. 2025 Feb 12;13(2):e010205.
doi: 10.1136/jitc-2024-010205.

CD56bright cytokine-induced memory-like NK cells and NK-cell engagers synergize against non-small cell lung cancer cancer-stem cells

Affiliations

CD56bright cytokine-induced memory-like NK cells and NK-cell engagers synergize against non-small cell lung cancer cancer-stem cells

Maria L Guevara Lopez et al. J Immunother Cancer. .

Abstract

Background: Due to their enhanced responsiveness and persistence, cytokine-induced memory-like (CIML)-natural killer (NK) cells have emerged as new immunotherapeutic tools against malignancies. However, their effects on tumor-cell spread and metastases in solid tumors remain poorly investigated. Moreover, a clear identification of the most effective CIML-NK subsets, especially in controlling cancer stem cells (CSC), is still lacking.

Methods: We performed combined phenotypical and functional analyses of CIML-NK cell subsets, either selected by flow-cytometry gating, or generated from sorted CD56bright/CD56dim NK cells.By co-culture experiments, we analyzed the effect of CIML-NK cells on non-small cell lung cancer (NSCLC) cell spheroids, or patient-derived xenografts (PDX), assessing changes in their CSC content, tumorigenicity, and/or tumor disseminating capability in vivo. CIML-NK cells were also infused in PDX-bearing mice to validate their effect on the CSC dissemination from the PDX to the lungs.Finally, we generated and functionally analyzed CIML-NK cells from patients with stages I/III NSCLC (n=6).

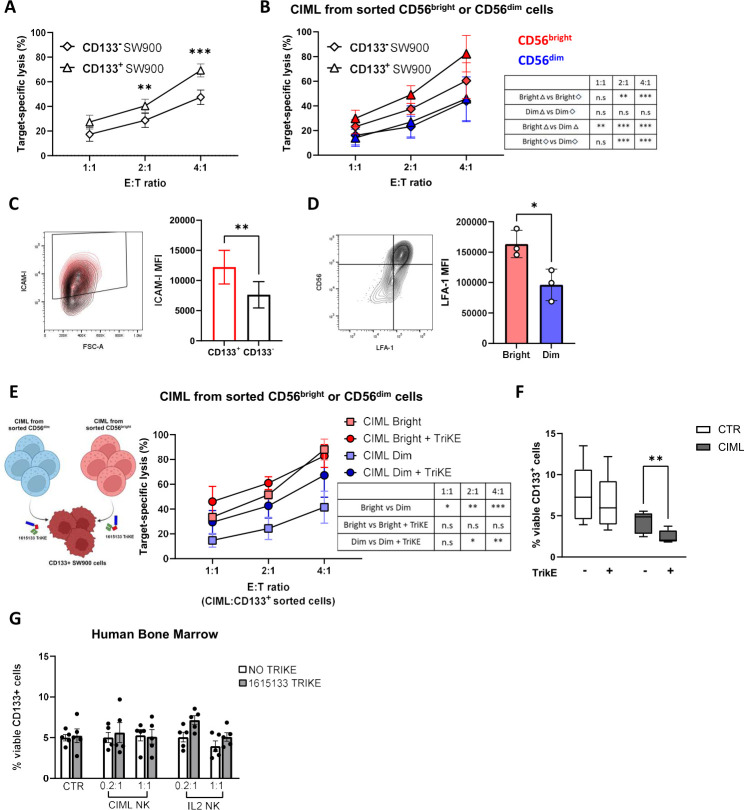
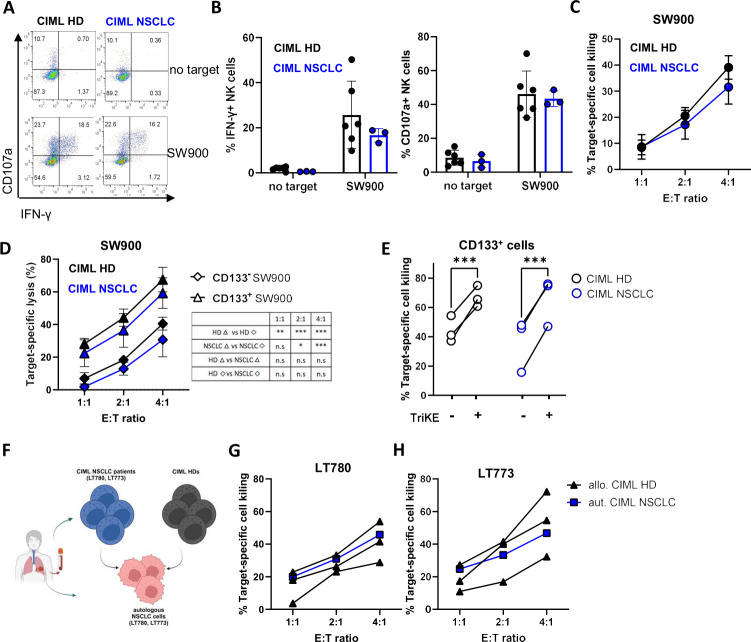
Results: We show that CIML-NK cells exert antitumor activity mostly through their CD56bright cell subset, which greatly expands during CIML differentiation. Compared with NK cells conventionally activated with interleukin-2, CIML-NK cells express lower levels of check-point receptors, TIGIT and TIM3, and higher effector functions against NSCLC cells from PDX, and against in vitro-generated tumor spheroids. Remarkably, CIML-NK cells also significantly reduce the CSC-containing CD133+ cell subpopulation within spheroids and PDX, and limit tumor cell tumorigenicity and ability to disseminate CSCs from primary tumors to distant sites. Sorting experiments on CIML or tumor cell subsets reveal that CD56bright cells drive most of this anti-CSC activity, and suggest that such functional advantage could be related to increased expression of LFA-1 and ICAM-1 on CD56bright cells and CSCs, respectively. We also show that the tri-specific killer cell engager (TriKE) 1615133 significantly enhances CIML-NK cell activity against CSCs. Finally, we demonstrate that CIML-NK cells, capable of killing autologous tumor cells and responding to the 1615133 TriKE, could be induced from patients with NSCLC.

Conclusions: Our study discloses for the first time the therapeutic potential of CIML-NK cells in controlling CSCs and metastatic spread, highlighting the role of the CD56bright subset expansion and 1615133 TriKE for optimizing CIML-NK-based therapies against metastatic tumors.

Keywords: Cytokine; Immunotherapy; Innate; Lung Cancer; Natural killer - NK.


Conflict of interest statement

Competing interests: DAV and MF, and the University of Minnesota, are shared owners of the TriKE technology licensed by the University to GT Biopharma Inc. In addition, MF receives research support, consults for, and holds stock options in GT Biopharma Inc. No GT Biopharma funds were used in the creation of the TriKE molecule used in this study. These interests have been reviewed and managed by the University of Minnesota in accordance with its conflict of interest policy.

Figures

Figure 1
Figure 1. Characterization of freshly isolated NK (D0), IL-15(c)-NK, IL-2-NK and CIML-NK cells by flow cytometry. (A) Representative plots of CD56 versus CD16 expression showing the gating of CD56bright and CD56dim subsets. (B) Percentage of CD56bright cells in the different types of NK cells. Bars show mean±SD, and dots connected by lines represent percentages from each individual donor (n=11 donors). (C) Expansion of CD56bright cells in CIML-NK cells assessed at day 6 following cytokine priming. Prior to memory-like differentiation, naïve CD56bright and CD56dim cells were sorted, CD56bright were labeled with CellTrace Violet (CTV) and pooled with unlabeled CD56dim cells. The percentage of (CTV+) CD56bright cells was assessed by flow cytometric analysis before (day 0) and after (day 6) CIML differentiation (C, left). Representative flow cytometry plots and (C, right) graph displaying the percentage of CTV+ cells from each donor (individual dots) at days 0 and 6 (n=3 donors). (D) Proliferation of CIML-NK cells assessed at day 6 following cytokine priming. The assessment was done by flow cytometric analysis of CTV dilution on CIML derived from sorted CD56bright (red) or CD56dim (blue) cells (D, left). Representative flow cytometry plots and (D, right) violin plot summarizing proliferation data of CD56bright and CD56dim CIML-NK cells at day 6 quantified as division index (n=3 donors). (E, F) Characterization of the NK cell subsets as identified by the combined expression NKG2A and KIRs (Mix KIR) in the different indicated cell types. (E) Representative flow cytometry plots of NKG2A versus KIR expression and (F) bar graphs displaying the mean percentage of the subsets±SD (n=6 donors). (G) Proliferation of NKG2A+KIR (red), NKG2A+ KIR+ (green), and NKG2AKIR+ (violet) in CIML-NK generated from sorted CD56dim cells assessed by flow cytometric analysis of CTV dilution (G, left). Representative flow cytometry plots and (G, right) violin plot showing the division index in each subset at day 6 (n=3 donors). Groups were compared using a one-way repeated measures analysis of variance with post hoc Tukey test (B, F, G) and paired two-tailed t-test (C, D) (⁎p<0.05; ⁎⁎p<0.01; ⁎⁎⁎p<0.001). CIML, cytokine-induced memory-like; IL, interleukin; NK, natural killer.
Figure 2
Figure 2. Functional characterization of CIML, IL-15(c), and IL-2-NK cells against NSCLC cell lines, evaluation of the CD56bright and CD56dim CIML subsets. (A–B) The different NK cell types were co-cultured with the indicated NSCLC cell lines (E:T ratio of 1:1) for 6 hours, and the production of IFN-γ or the expression of CD107a on NK cells (gated as CD56+ cells) was measured by flow cytometry. Data are shown as box and whisker plots with median±minimum to maximum of n=5–6 donors. (C–E) CIML-NK cells were generated from pooled labeled (CTV+) CD56bright and unlabeled (CTVneg) CD56dim naïve NK cells, and then cultured with or without the indicated cell lines for functional assessments. (C) Representative flow cytometry plots showing: (left) the gating of CTV+ (red) and CTVneg (blue) cells in day 6 CIML-NK cells, and (right) the CD107a versus IFN-γ expression on the gated subsets of CIML-NK cells in the different co-culture conditions. (D,E) Cumulative data on the frequencies of IFN-γ+ or CD107a+ cells in CD56bright (CTV+, red) and CD56dim (CTVneg, blue) subsets of unstimulated/stimulated CIML NK cells (n=3 donors). (F) Calcein-based cytotoxicity of SW900 cells on co-culture with CIML-NK cells differentiated from sorted CD56bright (red), sorted CD56dim (blue), or unsorted (black) NK cells. The graph displays the mean cytotoxicity±SD of n=4 donors at different E:T ratios performed in technical duplicates. (G) Flow cytometry analysis of granzyme B expression in the total (CD56+), CD56bright, and CD56dim NK cell populations of CIML-NK, IL15(c)-NK, and IL-2-NK cells. Bars display the mean percentage of granzyme B-positive cells of n=4 donors. Dots represent the percentage of positive cells in each individual donor. Comparisons between groups were performed using one-way ANOVA with Tukey post hoc test (A, B, G) or a two-way ANOVA with Sidak post test (D–F). Only significant values are shown (⁎p<0.05; ⁎⁎p<0.01; ⁎⁎⁎p<0.001). ANOVA, analysis of variance; CIML, cytokine-induced memory-like; CTV, CellTrace Violet; Effector, (E): Target, (T); IFN, interferon; IL, interleukin; NK, natural killer; NSCLC, non-small cell lung cancer.
Figure 3
Figure 3. Functional characterization of CIML, IL-15(c) and IL-2 NK cells against non-small cell lung cancer spheroids. (A–D) Evaluation of NK cell functional response to spheroid-derived cells. (A, B) CIML-NK, IL-15(c)-NK, IL-2-NK cells and CIML-NK cells boosted with IL-2 (CIML+IL-2) were co-cultured for 6 hours with H3122, A549, H661 or SW900 spheroid-derived cells. Afterward, the expression of IFN-γ and CD107a was measured on NK cells by flow cytometric analysis. Data are shown as box a whisker plots with median±minimum to maximum, dots represent the value of each single donor. Number of NK cell donors analyzed, n=6 (SW900, H661), n=5 (H3122), n=4 (A549). (C, D) Evaluation of NK cell cytotoxicity against spheroid-derived cells. The specific lysis of CFSE-labeled SW900 or A549 spheroid-derived cells was measured after 24 hours of co-culture with the indicated NK cell types at different E:T ratios. After co-culture, target cells were stained with dead cell marker and annexin V, and assessed by flow cytometry gating on CFSE-positive events. (E–H) Evaluation of NK cell cytotoxicity in the context of cell aggregates (spheroids). SW900 and A549 spheroids were co-cultured with the different NK cells (E:T ratio 8:1) in the presence of caspase 3–7 green dye in a 96-well plates. Wells were imaged every hour for 48 hours to quantify the caspase 3–7 activation (green signal) within the spheroids using the IncuCyte system. (E, G) Representative images of SW900 and A549 spheroids co-cultured with the different NK cell types displaying caspase activation (at time=48 hours), and quantification of caspase activation (green mean intensity) normalized to control in spheroid boundary. Graphs show mean±SEM of n=3 donors ran in triplicates. (F, H) Visualization of target-specific caspase 3–7 activity at the indicated time points of the co-culture as bar graphs showing mean+SEM. Groups were compared using a one-way (A–B) or two-way analysis of variance (C–H). (⁎p<0.05; ⁎⁎p<0.01; ⁎⁎⁎p<0.001). Carboxyfluorescein succinimidyl ester, (CFSE); CIML, cytokine-induced memory-like; Effector, (E): Target, (T); IFN, interferon; IL, interleukin; NK, natural killer.
Figure 4
Figure 4. CIML-NK cells target spheroid and PDX CD133+ cells and limit tumorigenicity and tumor dissemination in vivo. (A–C) Analysis of the effect of NK cells on spheroids. A549 spheroids were co-cultured for 24 hours at a 1:1 E:T ratio with CIML-NK, IL15(c)-NK, IL-2-NK cells, or CIML-NK cells boosted with IL-2 (CIML+IL-2), or were cultured alone (CTRL). Next, spheroids were dissociated, NK cells were removed by depleting CD45+ cells (using CD45-specific microbeads) and recovered tumor cells were analyzed for viability and CD133 expression, and assayed for clonogenicity, in vitro, and tumorigenicity, in vivo. (A) Flow cytometry assessment of CD133+ percentage in the different co-cultures, reported as fold-change to control untreated spheroids. Data are shown as box and whisker plots with median±5–95 percentiles (n=3 donors). (B) In vitro clonogenicity assay of spheroid-derived cells. Viable tumor cells from dissociated spheroids were appropriately diluted and seeded in 6-well plates to follow colony formation (B, top). Image of a representative experiment. Wells were stained with crystal violet for clone evaluation (B, bottom). Bar graphs showing the mean normalized relative absorbances of the crystal violet dissolved with 10% acetic acid of n=3 donors ran in technical triplicates. (C) In vivo tumorigenicity of spheroid-derived tumor cells. Viable tumor cells from dissociated spheroids were s.c inoculated to NSG mice, and tumor formation and growth was followed over time. Bar graph shows the mean maximum tumor volume±SD reached per group (n=6 mice per group). (D–H) Analysis of the effect of NK cells on PDX (patient LT710). PDX cells were co-cultured for 4 hours with the different NK cell types or cultured alone (CTRL). Next, NK cells were removed from co-cultures by depleting CD45+ cells and tumor cells were analyzed for tumorigenicity in vivo. (D) Assessment of in vivo tumorigenicity of PDX cells from the indicated cultures. Mean group tumor growth curve+SD are shown (n=4 mice/group). (E–H) Evaluation of tumor cell dissemination to the lungs from subcutaneous PDXs. Subcutaneous tumors were generated from PDX cells from the indicated cultures. (E) Percentage of lung disseminating tumor cells (DTC) assessed by flow cytometry. DTC were identified as viable-H2K (non-murine) cells. (F) Percentage of CD133+ cells within the lung DTCs assessed by flow cytometry. Data are shown as box and whisker plots with median±minimum to maximum values (n=4 mice per group). (G) Representative images of IHC staining to evaluate the presence of CK+metastatic nodules (at higher magnification in the insets) in lung tissue sections. (H) Graph showing the number of CK+lung metastatic foci from each mouse (dots) and the mean foci number (line) per group. (I–K) Effect of CIML-NK cells in vivo. 5×10⁶ CIML-NK cells were inoculated intravenous in near end-point PDX-bearing mice. 48 hours after, mice were sacrificed, lungs and primary s.c tumors were dissociated, and analyzed. (I) Percentage of lung DTC assessed by flow cytometry. (J) Percentage of CD133+ DTC and (K) percentage of CD133+ tumor cells in s.c tumors evaluated by flow cytometry. Data are shown as box and whisker plots with median±minimum to maximum values (n=6 mice per group ran in technical duplicates). (L) Heatmap showing the expression levels of major activating and inhibitory NK-cell ligands measured by flow cytometry on CD133+ and CD133neg PDX cells. (H) Flow cytometry analysis of the surface expression of LFA-1 in IL-15(c), IL-2-NK, and CIML-NK cells. Bars report mean MFI±SD and dots represent MFI values of individual donors (n=3 donors). Comparisons between groups were assessed using one-way ANOVA with Dunnett’s multiple comparison test (A, C), Turkey post hoc test (B, E, F, H–K, L) or two-way ANOVA (D). Only significant values are shown (⁎p<0.05; ⁎⁎p<0.01; ⁎⁎⁎p<0.001). ANOVA, analysis of variance; CIML, cytokine-induced memory-like; Effector, (E):Target, (T); IL, interleukin; Immunohistochemistry, (IHC); Mean Fluorescence Intensity, (MFI); NK, natural killer; PDX, patient-derived xenograft.
Figure 5
Figure 5. CD56bright CIML-NK cells drive the killing of CD133+ non-small cell lung cancer cells, and 1615133 TriKE maximize this effect by triggering CD56dim CIML-NK cell activity. (A) Calcein-based cytotoxicity assay of CIML-NK cells against sorted CD133+ and CD133 SW900 cells. (B) Specific lysis of sorted CD133 or CD133+ SW900 cells by CIML-NK derived from sorted CD56bright or CD56dim cells. Graphs (A, B) show the mean percentage±SD of n=4 donors ran in technical duplicates. (C) ICAM-1 expression on CD133+ (red) or CD133 (black) SW900 cells. (D) LFA-1 expression on CD56bright and CD56dim CIML-NK cells. Bars (C, D) show the mean MFI±SD of 3 independent experiments. (E–F) Study of the effect of 1615133 Trike on the targeting of CD133+ by CIML NK cells. (E) CD133+ SW900-specific lysis by CIML-NK derived from sorted CD56bright or CD56dim cells in the presence or absence of 1615133 TriKE. Graphs show the mean percentage±SD of n=3 donors ran in technical duplicates. (F) 1615133 TrikE enhances the CD133+ cell targeting capability of CIML-NK cells. Box and whisker plot showing the median percentage±min to max of CD133+ viable SW900 cells after co-culture with CIML-NK cells in the presence or absence of 1615133 TriKE (n=4 donors). (G) CIML-NK cells and 1615133 TriKE do not modify the CD133+ cell content in human bone marrow. Human bone marrow cells were co-cultured with the indicated NK cells (CIML-NK or IL-2-NK) at the indicated E:T ratios in the presence/absence of TriKE. The percentage of viable CD133+ cells was assessed by flow cytometry. Comparisons between groups were performed through two-way analysis of variance (A, B, E–G) two-tailed t-tests (C, D) (⁎p<0.05; ⁎⁎p<0.01; ⁎⁎⁎p<0.001). CIML, cytokine-induced memory-like; Effector, (E):Target, (T); IL, interleukin; Mean Fluorescence Intensity, (MFI); NK, natural killer; TriKE, tri-specific cell engager.
Figure 6
Figure 6. Effective CIML NK cells can be generated from patients with NSCLC at different disease stages. (A–C) Functional assessment of CIML NK cells derived from PBMCs from healthy donors (CIML HD, black) or patients with stage I–III NSCLC (CIML NSCLC, blue) against SW900 cells. (A) Representative flow cytometry plots of CD107a versus IFN-γ expression by CIML-NK cells. (B) Bar graphs showing the mean±SD expression of IFN-γ (left) and CD107a (right) gated on CD56+ cells. Dots represent the values from each individual donor. (C) SW900-specific lysis by CIML HD (black) or CIML NSCLC (blue) at different E:T ratios. Graphs show the mean percentage±SD of n=6 donors per group ran in technical duplicates. (D) Specific lysis of sorted CD133 or CD133+ SW900 cells by CIML HD (black) or CIML NSCLC (blue) at different E:T ratios. Graph shows mean percentage±SD of each group of n=3 donors per group ran in technical duplicates. (E) CD133+ SW900-specific lysis by CIML HD or CIML NSCLC at a 2:1 E:T ratio in the presence or absence of 1615133 TriKE. Graphs show the percentage of each donor (n=3) ran in technical duplicates. (F–H) NSCLC CIML NK cells are effective against autologous tumor cells. (F) Cartoon summarizing the strategy. Primary tumor cells were isolated from LT780 and LT773 patients and assessed in a calcein-based cytotoxicity assay against autologous or HD (allogeneic) CIML-NK cells. LT780- (G) and LT773- (H) specific cytotoxicity by autologous (aut. CIML NSCLC, blue) or allogenic (allo. CIML HD, black) CIML-NK cells at different E:T ratios. Graphs show the mean values of each donor ran in technical duplicates (n=3 HD and 1 NSCLC donors). Groups were compared using a two-way analysis of variance. (⁎p<0.05; ⁎⁎p<0.01; ⁎⁎⁎p<0.001). CIML, cytokine-induced memory-like; Effector, (E):Target, (T); HD, healthy donors; IFN, interferon; NK, natural killer; NSCLC, non-small cell lung cancer; Peripheral Blood Mononuclear Cell, (PBMC); TriKE, tri-specific cell engager.

References

    1. Herbst RS, Morgensztern D, Boshoff C. The biology and management of non-small cell lung cancer. Nature New Biol. 2018;553:446–54. doi: 10.1038/nature25183. - DOI - PubMed
    1. Chockley PJ, Chen J, Chen G, et al. Epithelial-mesenchymal transition leads to NK cell-mediated metastasis-specific immunosurveillance in lung cancer. J Clin Invest. 2018;128:1384–96. doi: 10.1172/JCI97611. - DOI - PMC - PubMed
    1. Lorenzo-Herrero S, López-Soto A, Sordo-Bahamonde C, et al. NK Cell-Based Immunotherapy in Cancer Metastasis. Cancers (Basel) 2018;11:29. doi: 10.3390/cancers11010029. - DOI - PMC - PubMed
    1. Voutsadakis IA. Expression and function of immune ligand-receptor pairs in NK cells and cancer stem cells: therapeutic implications. Cell Oncol. 2018;41:107–21. doi: 10.1007/s13402-018-0373-9. - DOI - PubMed
    1. Freud AG, Mundy-Bosse BL, Yu J, et al. The Broad Spectrum of Human Natural Killer Cell Diversity. Immunity. 2017;47:820–33. doi: 10.1016/j.immuni.2017.10.008. - DOI - PMC - PubMed