. 2025 Feb 12;16(1):1587.
doi: 10.1038/s41467-025-56880-0.

Nuclear position controls the activity of cortical actomyosin networks powering simultaneous morphogenetic events

Affiliations

Nuclear position controls the activity of cortical actomyosin networks powering simultaneous morphogenetic events

Nicolas Roby et al. Nat Commun. .

Abstract

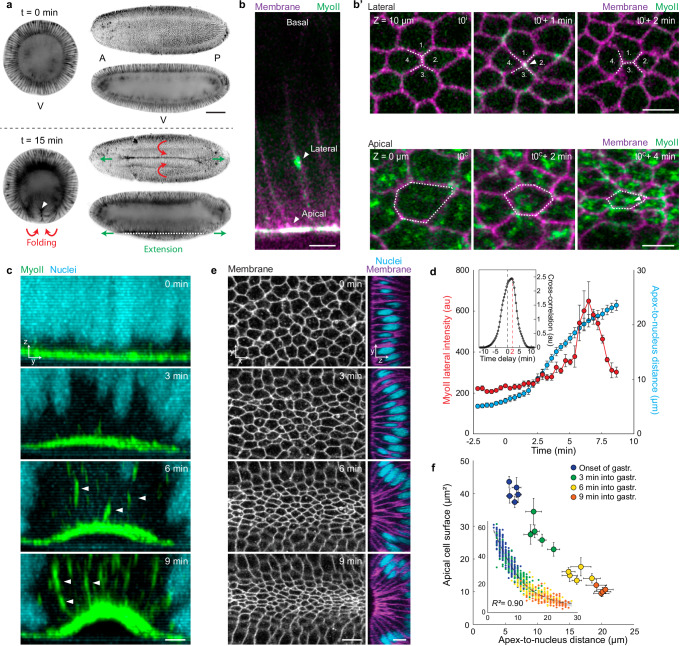
Tissue morphogenesis shapes epithelial sheets via cell remodelling to form functional living organisms. While the mechanisms underlying single morphogenetic events are well studied, how one tissue undergoes multiple concomitant shape changes remains largely unexplored. To tackle this, we study the process of simultaneous mesoderm folding and extension in the gastrulating Drosophila embryo. This composite transformation relies on a sharply timed reorganization of the cortical actomyosin network into two distinct subcellular tiers to drive concomitant cell apical constriction and lateral intercalation for tissue folding and convergence-extension, respectively. Here we elucidate the spatio-temporal control of the two-tiered actomyosin network. We show that, within the geometric constraints imposed by the columnar shape of mesoderm epithelial cells, the nucleus acts as a barrier shielding the lateral cortex from interactions with the microtubule network, thereby regulating the distribution of the key signalling molecule RhoGEF2. The relocation of the nucleus, driven by the contraction of the first actomyosin tier and the resulting cytoplasmic flow, unshields the lateral cortex for RhoGEF2 delivery to direct the stereotypic formation of the second tier. Thus, the nucleus and its position function as a spatio-temporal cytoskeleton compartmentalizer establishing a modular scaffold powering multiple simultaneous cell remodeling for composite morphogenesis.


Conflict of interest statement

Competing interests: The authors declare no competing interests.

Figures

Fig. 1
Fig. 1. Nuclear migration precedes MyoII-LC formation.
a The prospective mesoderm simultaneously folds and extends at the onset of Drosophila gastrulation. Cross-section (left), surface view (top-right) and sagittal section (bottom-right). White arrowhead and dashed line indicate the furrow position. Scale bar, 50 µm. b Sagittal view of mesoderm cells showing a two-tier organization of MyoII. Scale bar, 5 µm. b’ Time-lapse showing the lateral and apical pool of MyoII driving cell intercalation (top) and apical constriction (bottom), respectively. Scale bars, 5 µm. c Time-lapse of the mesoderm cross-section during ventral furrowing. Arrowheads indicate MyoII-LCs. Scale bar, 10 µm. d MyoII lateral intensity and nuclear position in function of time. Inset: temporal cross-correlation between the peak of nuclear migration speed and the peak of MyoII lateral recruitment. Apex-to-nucleus distance: distance between the apical side of the cell and the apical side of the nucleus. Data points represent the mean values with error bars indicating the 95% confidence interval (n = 3 embryos, N = 45 junctions, N = 30 nuclei). e Mesoderm front view (left) and cross-section (right) time-lapse showing apical constriction and the associated nuclear displacement. Scale bars, 10 µm. f Mean nuclear position in function of the mean apical cell surface at different phases of mesoderm invagination. Inset: raw individual values with an exponential fit (y = 69.212*e-0.096x). Data points represent the mean values with error bars indicating the 95% confidence intervals (n = 5 embryos, N = 925 cells, N = 925 nuclei). Source data are provided as a Source Data file.
Fig. 2
Fig. 2. Constriction-induced cytoplasmic flow controls nuclear position and MyoII-LC formation.
a Mesoderm tissue upon laser dissection of the apical actomyosin network along two DV segments (dashed lines). Blue and red segments indicate control and cut cells, respectively. Scale bar, 10 µm. b Schematic representation of cell shape, nuclear position and MyoII distribution in the control (blue) and cut (red) region. Cross: dissection of the apical actomyosin network. Arrowheads: apical contraction forces. c Front view at 10 µm from the apical side and sagittal section of the mesoderm at the onset of and 7 min into gastrulation. Crosses indicate the sites of ablation (performed at the onset of gastrulation). Arrowheads indicate MyoII-LCs. Scale bar, 10 µm. c’ Magnified views of MyoII-LC distribution in the control (1) and cut (2) region. Scale bars, 5 µm. d Nuclear position in the control (blue) and cut (red) region and in control embryos (grey) devoid of laser dissection. Apex-to-nucleus distance corresponds to the distance between the apical side of the cell and the apical side of the nucleus. The boxplot shows the median (line), interquartile range (IQR, box), and data spread with whiskers extending to 1.5x the IQR.(n = 6 embryos, N = 90 nuclei). e MyoII intensity at 10 µm from the apical side at the onset of and 7 min into gastrulation in the region where nuclei fail to migrate as a result of apical laser ablation, in the control region and in control embryos. The barplot represents the mean values with error bars indicating the 95% confidence interval(n = 6 embryos, N = 88 junctions). f Cytoplasmic flow along the cell apical-basal axis in cut and control cells in function of changes in apical cell surface. Data points represent individual values (n = 5 embryos, N = 24 beads, N = 24 cells). P values in (d): 0.462, 0.0673, >0.9999 (onset of gastr.)/ <0.0001, 0.0003, <0.0001 (7 min into gastr.). P values in (e): 0.0736, 0.5272, >0.9999 (onset of gastr.)/>0.9999, <0.0001, <0.0001 (7 min into gastr.). Source data are provided as a Source Data file.
Fig. 3
Fig. 3. The position of the nucleus dictates MyoII-LC apicobasal location.
a Sagittal view of mesoderm cells showing MyoII-LC (white arrowhead) and the two corresponding nuclei. Dashed line highlights the cell outline. Scale bar, 5 µm. a Top: Schematic representation of two cell sharing a MyoII-LC. Bottom: schematic representation of the initiation of a cell intercalation event (A is anterior, P posterior, D dorsal and V ventral). b Quantification of MyoII-to-nuclei relative position (as described by the inset formula) in different conditions (refer to a’). Right axis: associated standard deviation for each condition. The boxplot shows the median (line), interquartile range (IQR, box), and data spread with whiskers extending to 1.5x the IQR. (n = 5 embryos, N = 50 clusters, N = 200 nuclei). c Top: time-lapse showing the ablation of the apical actomyosin network over an extended portion of the mesoderm. Bottom: magnified views showing MyoII distribution in the control (left) and cut (right) region. Nuclei, that fail to migrate, are visible in black at 10 µm depth in the cut region. Arrowheads indicate MyoII-LCs. Scale bars, 10 µm. d Schematic representation of the centrifugation protocol employed to drive enhanced nuclear basal migration (see Supplementary Methods). e Mesoderm front view at 15 µm depth and cross-section in centrifuged (top) and control (bottom) embryos. Arrowheads indicate MyoII-LCs. Cross-sections show nuclei in cyan and MyoII in purple. Scale bars, 10 µm. f Apico-basal distribution of MyoII-LCs in embryos undergoing reduced nuclear migration (blue), control embryos (grey) and centrifuged embryos (purple). Inset shows the cumulative density relative to the apico-basal position of MyoII-LCs (n = 12 embryos, N = 565 clusters). g MyoII-LC apico-basal position relative to the average AP nuclear position. Data points represent individual values (refer to a’). Apex-to-nucleus distance corresponds to the distance between the apical side of the cell and the apical side of the nucleus. Inset: quantification of MyoII-to-nuclei relative position for each individual cluster-nuclei pair. The boxplot shows the median (line), interquartile range (IQR, box), and data spread with whiskers extending to 1.5x the IQR. (n = 16 embryos, N = 140 clusters, N = 280 nuclei). Source data are provided as a Source Data file.
Fig. 4
Fig. 4. Nuclear-dependent MT redistribution controls lateral RhoGEF2 recruitment.
a Sagittal view of mesoderm cells showing EB1 distribution along the cell lateral cortex at the onset of (top) and 7 min into gastrulation (bottom). Scale bar, 10 µm. b Cortical over cytoplasmic ratio of EB1 at the lateral cortex of mesoderm cells (5 to 15 µm) at the onset of and 7 min into gastrulation. The boxplot shows the median (line), interquartile range (IQR, box), and data spread with whiskers extending to 1.5x the IQR. (n = 3 embryos, N = 29 cortices). c Left: EB1 distribution at 10 µm depth before (top) and after (bottom) apical laser dissection (dashed line) and nuclear displacement. Right: magnified views of the control region (blue) and the region where nuclei relocate apically after ablation (red). Scale bars, 10 µm, 5 µm. d EB1 intensity along the cell lateral cortex at 10 µm depth in the control (blue) and in the apical nuclear relocation (red) region. The barplot represents the mean values with error bars indicating the 95% confidence interval (n = 5 embryos, N = 146 cells). e 3D representation of the MT network by mathematical simulation with the nucleus located apically, basally and with MTOCs separated from the nucleus. f Percentage (and associated confidence interval) of MT plus ends along the cell lateral cortex between the apical side and the nucleus (blue) and between the nucleus and the basal side (red) in different conditions (refer to e). g, h, i, MT plus-end distribution along the cell lateral cortex in the three different conditions (refer to e).  = 100 simulations per condition. The blue and red areas indicate locations between the apical side of the cell and the nucleus and between the nucleus and the basal side of the cell, respectively (see inset). j RhoGEF2 distribution in mesoderm cells at 10 µm from the apical side upon live-injection of water (top) or Colcemid (bottom). Scale bar, 5 µm. k Cortical over cytoplasmic ratios of RhoGEF2 in control embryos (water live-injected or water photo-activated) or upon MT disruption (Colcemid live-injection or SbTub4AP photo-activation with a 405 nm laser). The boxplot shows the median (line), interquartile range (IQR, box), and data spread with whiskers extending to 1.5x the IQR. (n = 12 embryos, N = 145 cells). l Mesoderm front view time-lapse at 10 µm from the apical side showing MyoII distribution in WT (left) or T48 mutant (right) embryos. Scale bar, 10 µm. m Normalized density of MyoII-LCs in WT or T48 mutant embryos. The barplot represents the mean values with error bars indicating the 95% confidence interval (n = 12 embryos, N = 2664 cells). P value in (b): <0.0001. P values in (d): >0.9999 (before abl.), <0.0001 (after abl.). P values in (k): 0.0766 (Water live), <0.0001 (Colcemid live), >0.9999 (Water photo-activated), <0.0001 (SbTub4AP photo-activated). P value in (m): <0.0001. Source data are provided as a Source Data file.

References

    1. Heisenberg, C. P. & Bellaiche, Y. Forces in tissue morphogenesis and patterning. Cell153, 948–962 (2013). - PubMed
    1. Lecuit, T. & Yap, A. S. E-cadherin junctions as active mechanical integrators in tissue dynamics. Nat. Cell Biol.17, 533–539 (2015). - PubMed
    1. Salbreux, G., Charras, G. & Paluch, E. Actin cortex mechanics and cellular morphogenesis. Trends Cell Biol.22, 536–545 (2012). - PubMed
    1. Roper, K. Microtubules enter centre stage for morphogenesis. Philos. Trans. R. Soc. Lond. B Biol. Sci.375, 20190557 (2020). - PMC - PubMed
    1. Pradeau-Phelut, L. & Etienne-Manneville, S. Cytoskeletal crosstalk: A focus on intermediate filaments. Curr. Opin. Cell Biol.87, 102325 (2024). - PubMed

LinkOut - more resources