. 2025 Feb 12;15(1):5252.
doi: 10.1038/s41598-025-89847-8.

Quinalizarin induces autophagy, apoptosis and mitotic catastrophe in cervical and prostate cancer cells

Affiliations

Quinalizarin induces autophagy, apoptosis and mitotic catastrophe in cervical and prostate cancer cells

Wojciech Trybus et al. Sci Rep. .

Abstract

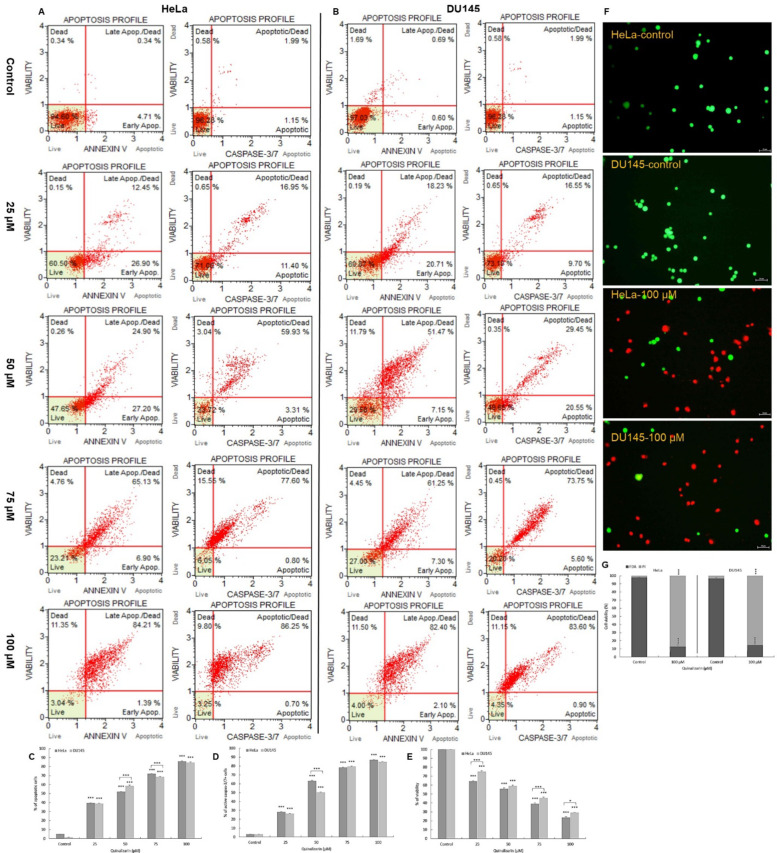
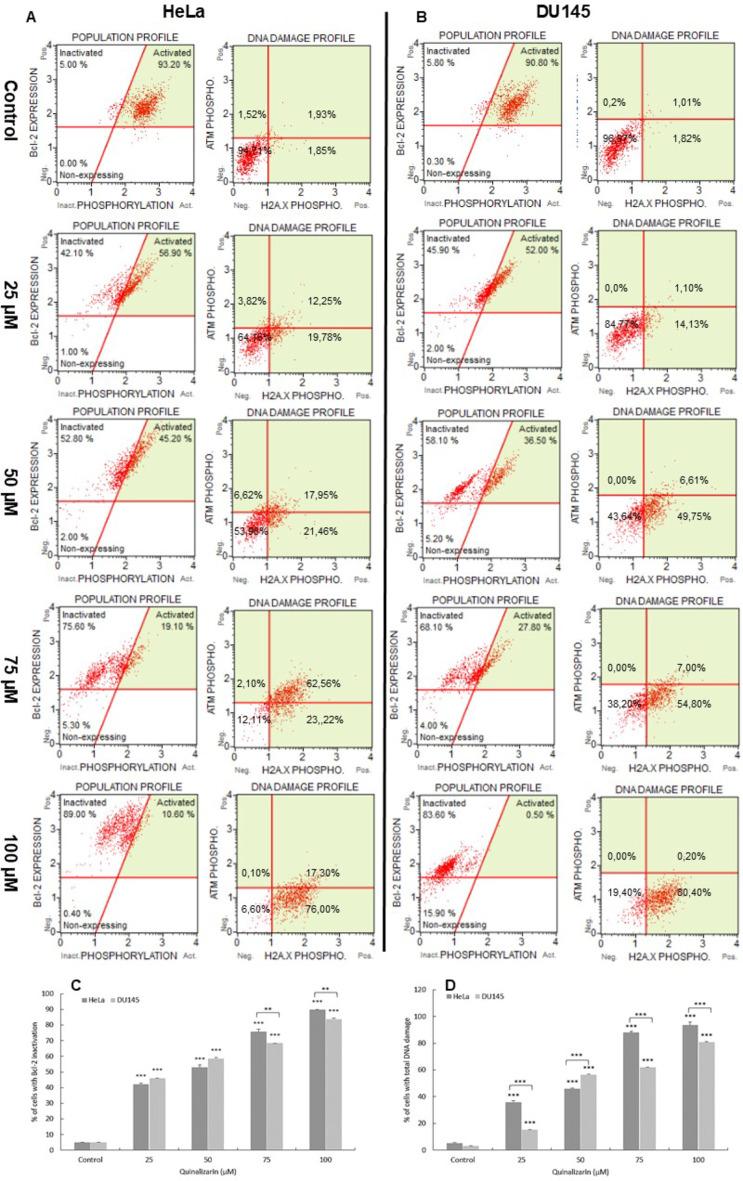
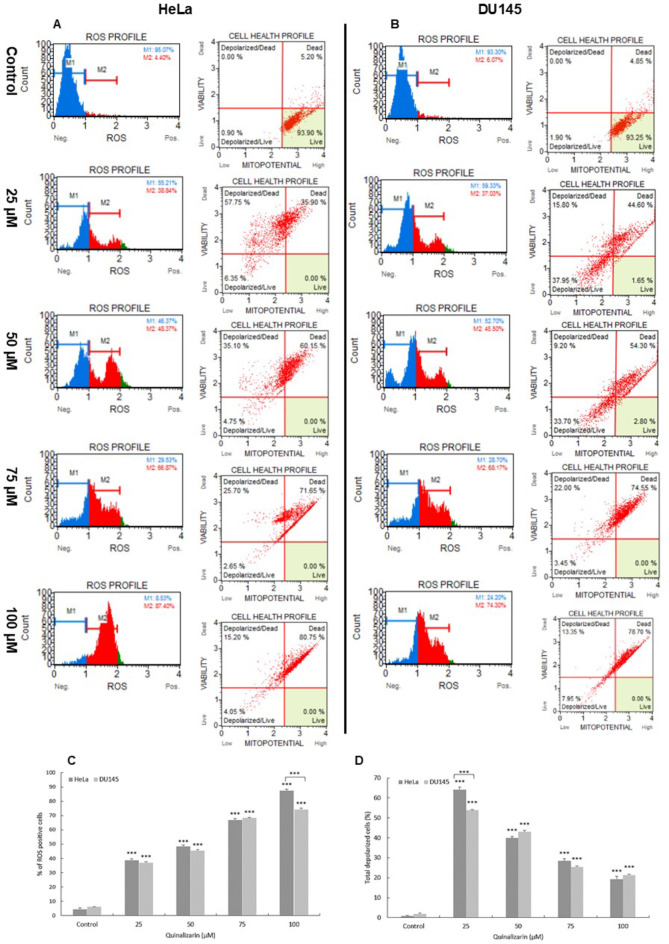
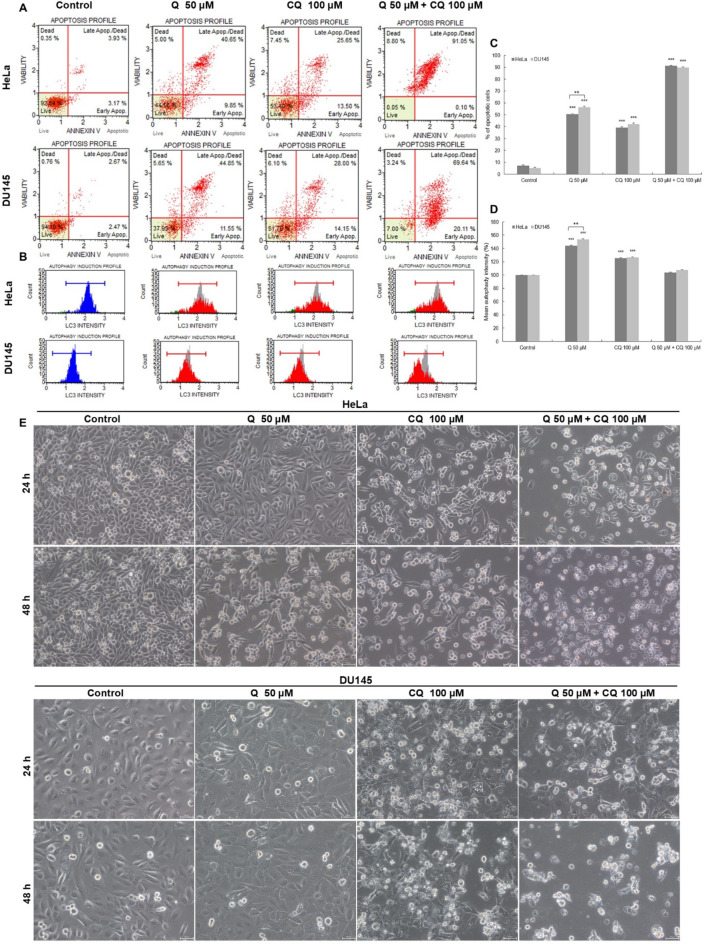
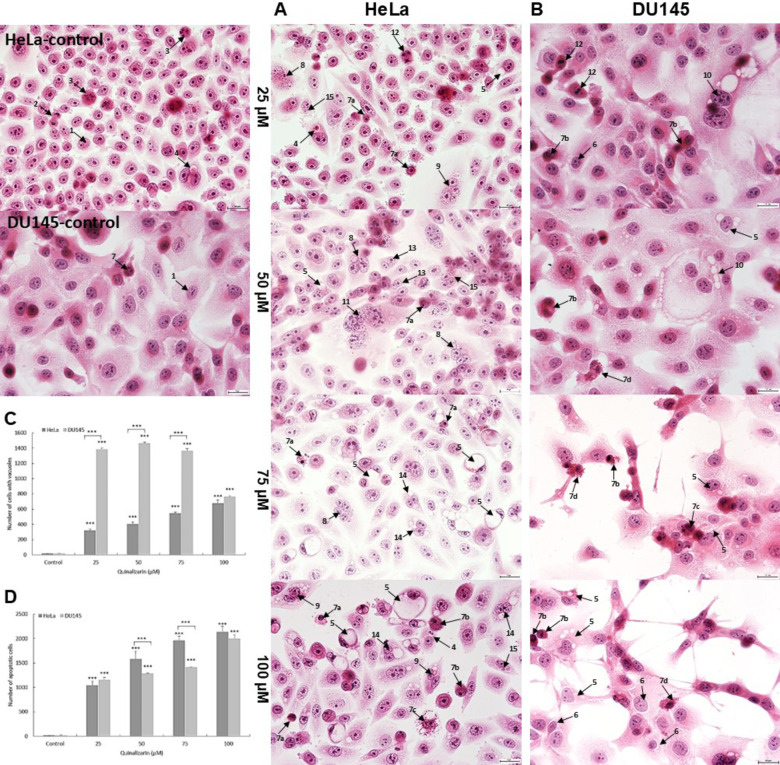
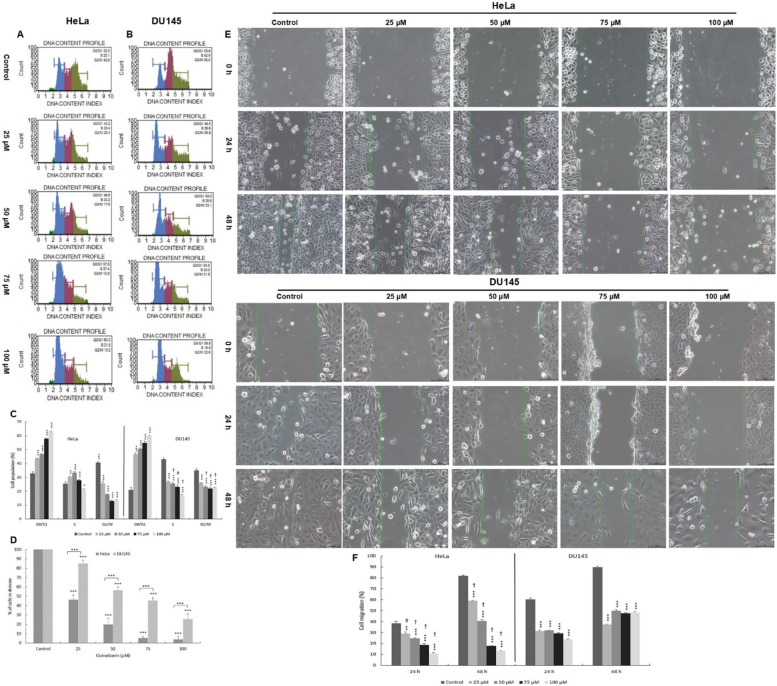
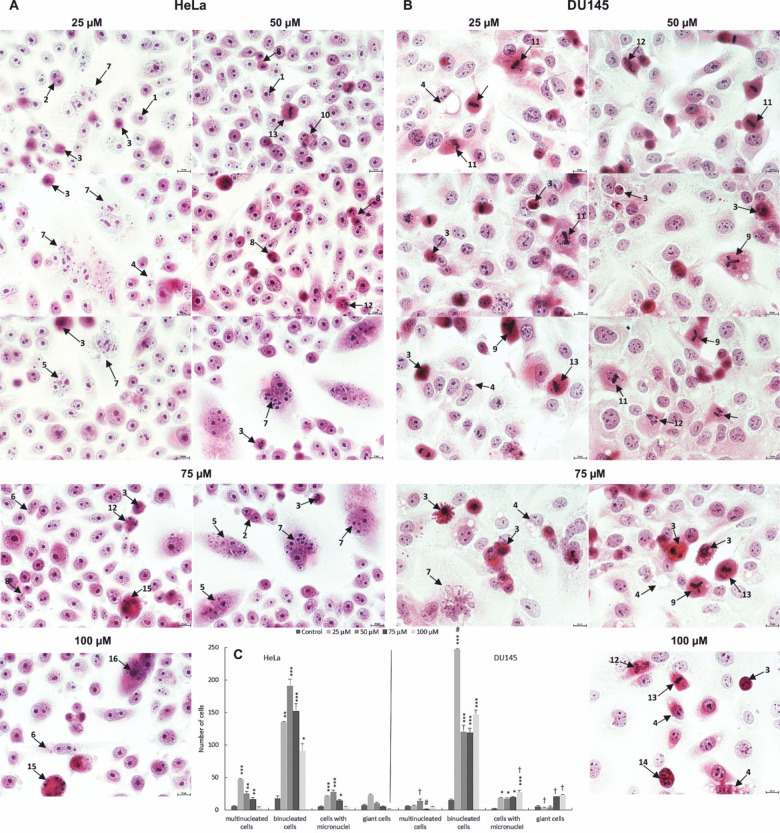
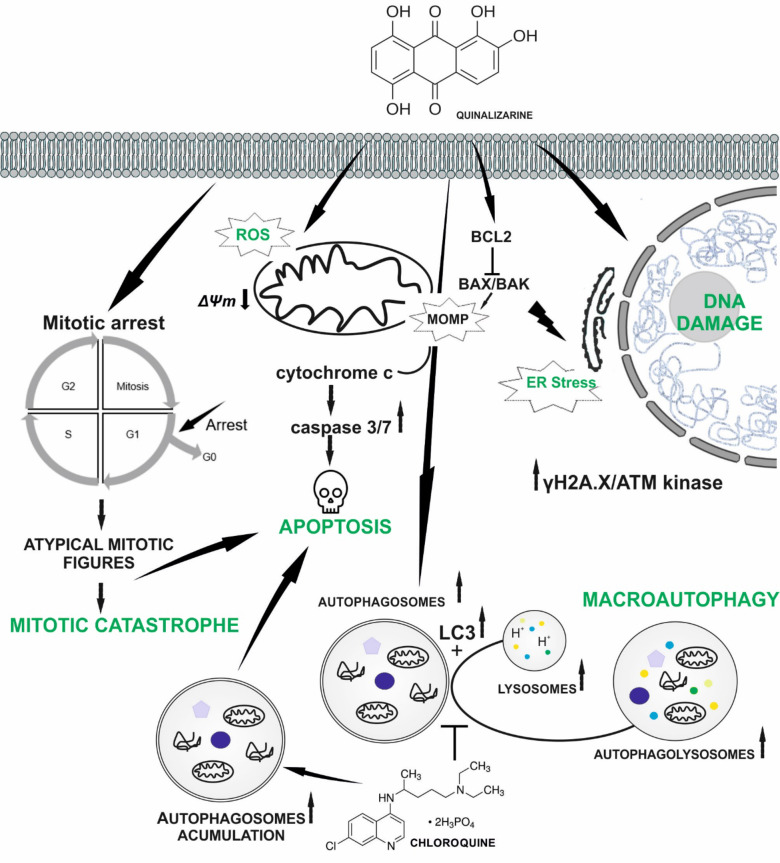
Cancer diseases are a serious health problem for society, and among them cervical and prostate cancer rank high in terms of mortality. One of the reasons is the phenomenon of drug resistance and side effects accompanying conventional chemo- and radiotherapy. This requires continuous development of alternative treatment methods and searching for new compounds with anti-cancer potential. An example is quinalizarin, which was tested for its anti-cancer potential. The MTT test showed cytotoxic activity of quinalizarin against Hela and DU145 cell lines. Morphological analysis showed nuclear changes typical of apoptosis, which was confirmed by the annexin V/PE test, activation of caspases 3/7 and inhibition of Bcl-2 protein expression. Increased permeability of mitochondrial membranes and ROS generation were demonstrated. Inhibition of cell migration, blocking in the G0/G1 phase, increased number of cells with damaged DNA and an increase in markers of mitotic catastrophe, i.e. micro- and multinucleation including the presence of abnormal mitotic figures were also observed. At the same time, increased autophagy was observed, and preincubation of cells with chloroquine inhibited this process, which contributed to the increased cytotoxicity of quinalizarin towards the tested cells. Quinalizarin has a multidirectional effect based on apoptosis and alternative types of cell death.

Keywords: Apoptosis; Autophagy; Mitotic catastrophe; Oxidative stress; Quinalizarin.


Conflict of interest statement

Declarations. Competing interests: The authors declare no competing interests.

Figures

Fig. 1
Fig. 1
Proapoptotic effect of quinalizarin. HeLa and DU145 cells were treated for 48 h with quinalizarin at concentrations of 25 µM, 50 µM, 75 µM and 100 µM. Representative histograms of the distribution of apoptotic and caspase-positive cells of HeLa (A) and DU145 (B) lines. The level of apoptosis was determined by annexin V-PE/7-AAD staining. Live cells (annexin V-PE-/7-AAD-), early apoptotic cells (annexin V-PE+/7-AAD-), late apoptotic cells (annexin V-PE+/7-AAD+) and dead cells (annexin V-PE-/7-AAD+). The level of caspase 3/7 activity was assessed by the Muse Caspase-3/7 Kit. Live cells (caspase 3/7-/7-AAD-), early apoptotic cells (caspase 3/7+/7-AAD-), late apoptotic cells (caspase 3/7+/7-AAD+), dead cells (caspase 3/7-/7-AAD+). Comparison of the percentage of apoptotic cells (both early and late) (C) and caspase-positive cells (D) depending on the quinalizarin concentration in HeLa and DU145 cells. Cell viability determined by the MTT assay (E). Double staining with fluorescein acetate/propidium iodide (FDA/PI) of HeLa and DU145 cells (F). Fluorescent staining indicates live cells (green fluorescence emission), while red fluorescence corresponds to PI, which binds to DNA after membrane damage. Percentage distribution of live and dead cells after double staining with FDA and PI (G). Magnification 200 ×. Representative data from three parallel experiments corresponding to mean values. SEM standard error of the mean. Statistical differences were confirmed at: *p < 0.05; **p < 0.01; ***p < 0.001.
Fig. 2
Fig. 2
Inactivation of Bcl-2 protein and the degree of DNA damage in HeLa and DU145 cells exposed to 48 h of quinalizarin. Representative histograms of the distribution of cells with Bcl-2 protein inactivation and DNA damage in HeLa (A) and DU145 (B) cells. The histograms indicate over 80% dephosphorylation of Bcl-2 protein occurring in the studied cells after exposure to quinalizarin at a concentration of 100 µM. Scatter plots of the distribution of cells expressing the activation of ATM and H2A.X. The demonstrated coactivation of ATM and H2A.X (over 80%) after exposure to quinalizarin (100 µM) indicates double-stranded DNA breaks and its damage. Percentage of cells with Bcl-2 protein inactivation (C) and with double-stranded DNA breaks (dual activation of ATM and H2A.X) (D) induced by quinalizarin. Data representative of three parallel experiments correspond to mean values. SEM standard error of the mean. Statistical differences were confirmed at: *p < 0.05; **p < 0.01; ***p < 0.001.
Fig. 3
Fig. 3
Induction of oxidative stress in HeLa and DU145 cells by quinalizarin. Generation of reactive oxygen species and changes in mitochondrial membrane potential as a result of quinalizarin in HeLa (A) and DU145 (B) cells. Percentage of ROS (+) cells (C) and cells with mitochondrial membrane depolarization (D) observed at different quinalizarin concentrations. Each sample was analyzed three times. Differences were statistically confirmed at: *p < 0.05; **p < 0.01; ***p < 0.001.
Fig. 4
Fig. 4
Ultrastructural changes in HeLa and DU145 cell lines exposed to 48 h of quinalizarin. HeLa cells. (A) Control cell with normal morphology of the nucleus and organelles. Cells after quinalizarin treatment at a concentration of 25 µM with an increased number of swollen mitochondria. Cells treated with quinalizarin (50 µM)—numerous Golgi apparatuses with swollen and scattered cisternae, numerous autophagic vacuoles with visible double membrane and autophagolysosomes. Cells treated with a concentration of 75 µM—swollen rough reticulum, mitochondria with shortened and damaged cristae, numerous autophagolysosomes, primary and secondary lysosomes. A concentration of 100 µM quinalizarin caused severe swelling and complete electron-transparent of mitochondria, with numerous lysosomes and autophagic vacuoles visible. DU145 cells. (B) Control cell with normal morphology of the nucleus and normal structure of organelles. Cells after treatment with quinalizarin at a concentration of 25 µM with increased number of Golgi apparatuses with swollen cisternae. Cells treated with 50 µM quinalizarin–numerous Golgi apparatuses with scattered cisternae, numerous autophagic vacuoles and swollen mitochondria. Cells treated with a concentration of 75 µM—presence of mitochondria with damaged cristae, autophagic vacuoles, lysosomes and cytoskeletal elements. 100 µM concentration of quinalizarin caused strongly swollen and completely electron-transparent mitochondria with drawn into the membrane, numerous lysosomes and autophagic vacuoles. N cell nucleus, M mitochondria, VA autophagic vacuoles, AVL autophagolysosomes, AG Golgi apparatus, LP primary lysosomes, LS secondary lysosomes, RER rough endoplasmic reticulum. Magnification 11,500 ×. Quinalizarin concentration-dependent change in mitochondrial size (C). Quinalizarin modulates LC3-II protein expression. Representative histograms of HeLa (A’) and DU 145 (B’) cells after 48 h of treatment with quinalizarin at concentrations of 25–100 µM. Cells were stained with a conjugated anti-LC3/Alexa Fluor555 antibody, and fluorescence intensity was measured flow cytometrically. Percentage differences in LC3-II protein expression expressed by change in fluorescence intensity (D). Data represent mean values. SEM - standard error of the mean. Differences were statistically confirmed at the level of: *p < 0.05; **p < 0.01; ***p < 0.001.
Fig. 5
Fig. 5
Effect of combined action of quinalizarin and chloroquine on apoptosis induction in HeLa and DU145 cells. Cells were treated with quinalizarin (Q-50 µM) and chloroquine (CQ-100 µM) and combined action of compounds (Q-50 µM + CQ-100 µM) for 48 h. Apoptosis level was measured using Annexin V-PE/7-AAD staining (A), and LC3-II protein expression level was measured using flow cytometry (B). Percentage of apoptotic cells (C) and LC3-II expressing cells (D). Data represent mean values. SEM standard error of the mean. Differences were statistically confirmed at the level of: *p < 0.05; **p < 0.01; ***p < 0.001. Representative images showing the morphology of HeLa and DU145 cells, which were taken using the phase contrast technique. Visible vacuoles in the cytoplasm of the tested cells after the action of chloroquine (100 µM) and quinalizarin (50 µM). The combined action of the tested compounds increased the number of cells with vacuoles, confirming the inhibition of autophagic processes by chloroquine (24 h). As a result of 48-hour incubation of cells with quinalizarin and chloroquine, the proapoptotic effect of quinalizarin was enhanced-a reduced number of cells with vacuoles and a predominance of rounded and shrunken apoptotic cells. The images were taken using the phase contrast technique. Magnification ×200.
Fig. 6
Fig. 6
Morphological changes indicating the induction of vacuolation and apoptosis in HeLa and DU145 cell lines. Representative micrographs of HeLa (A) and DU145 (B) cells stained with the hematoxylin and eosin (H&E) method. Control cells with normal morphology, including interphase cells and cells in numerous mitotic divisions. Cells treated with quinalizarin at concentrations of 25–100 µM indicating vacuolation of the cytoplasm and apoptosis. Visible cells containing strongly eosinophilic material in vacuoles destined for degradation and cells with changes typical of apoptosis (pyknotic cell nuclei, nuclei with visible chromatin condensation, cells with apoptotic bodies). Explanation of symbols: 1—interphase, 2—late telophase, 3—prometaphase, 4—cells with vacuoles filled with degradation material, 5—cells with cytoplasmic vacuolation, 6—cells with perinuclear vacuolation, 7—apoptotic cells (a—pyknotic nucleus, b—chromatin condensation, c—nuclear fragmentation, d—apoptotic bodies), 8—multinucleated cells, 9—multinucleated cells with vacuoles, 10—giant cells with vacuoles, 11—giant cells, 12—cells with abnormal chromosome segregation, 13—binucleated cells, 14—binucleated cells with vacuoles, 15—cells with micronuclei. Images were taken at 400 × magnification. Quinalizarin concentration-dependent changes in the number of vacuolated (C) and apoptotic (D) cells.
Fig. 7
Fig. 7
Antiproliferative effect of quinalizarin on HeLa and DU145 cells. Changes in the cell cycle of HeLa (A) and DU145 (B) cells treated for 48 h with quinalizarin at concentrations of 25–100 µM (cytometric analysis). Percentage distribution of HeLa and DU145 cells in different phases of the cell cycle indicating blocking of cells in the G0/G1 phase (C). Changes in the mitotic index indicating inhibition of cell division by quinalizarin (D). The effect of quinalizarin on the migration of HeLa and DU145 cells was assessed by wound healing assay (E). Representative inverted phase contrast microscope images show the change in scratch width at different time intervals after cell migration in the control group and in the group of cells loaded with quinalizarin in the concentration range of 25–100 µM. (F) Quantification of the effect of quinalizarin on the migration potential of HeLa and DU145 cells. Magnification × 200. Results represent the mean values of three independent experiments ± SE. Statistical differences were confirmed at ***p < 0.001. The symbol # indicates a statistically significant change in wound size in the HeLa cell group (p < 0.01) for 25 µM quinalizarin compared to DU145 cells encumbranced with 25 µM quinalizarin. The symbol † indicates a statistically significant change in wound size in the HeLa cell group (p < 0.0001) for 50–100 µM quinalizarin compared to DU145 cells encumbranced with quinalizarin in the concentration range of 50–100 µM.
Fig. 8
Fig. 8
Morphological markers of mitotic catastrophe in HeLa (A) and DU145 (B) cell lines induced by 48-hour exposure to quinalizarin at concentrations of 25–100 µM. Increased mitotic changes expressed by the presence of abnormal mitotic figures, micro- and macronucleation. Quantitative changes in mitotic indices (cells with micronuclei, bi-, multinucleated cells and giant cells) after exposure to quinalizarin at concentrations of 25–100 µM (C). Differences were statistically confirmed at: *p < 0.05; **p < 0.01; ***p < 0.001. Symbol explanation: Statistically significant change (p < 0.01, symbol † and p < 0.0001, symbol #) in the number of multinucleated, binucleated, micronucleated and giant cells of the HeLa line compared to the number of the above mitotic catastrophe indicators in the DU145 cell line group loaded with quinalizarin in the concentration range of 25–100 µM. 1—interphase cells, 2—binucleated cells, 3—apoptotic cells, 4—cells with cytoplasmic vacuolation, 5—multinucleated cells, 6—cells with micronuclei, 7—giant cells, 8—chromosome bridges, 9—multipolar metaphase (bipolar, tripolar), 10—multipolar anaphase, 11—chromosome disorientation in metaphase, 12—cytoskeletal disorganization, 13—abnormal chromosome segregation, 14—apoptosis of binucleated cells, 15—apoptosis of multinucleated cells, 16—apoptosis of giant cells. Hematoxylin and eosin staining. Images were taken at 400 × magnification.
Fig. 9
Fig. 9
Summary of the potential anticancer mechanism of quinalizarin against HeLa and DU145 cells. Quinalizarin induces apoptosis, autophagy, and mitotic catastrophe dependent on the applied concentration and time of action. It also inhibits cell migration and induces cell cycle arrest.

References

    1. Sung, H. et al. Global cancer statistics 2020: GLOBOCAN estimates of incidence and mortality worldwide for 36 cancers in 185 countries. CA Cancer J. Clin.71, 209–249. 10.3322/caac.21660 (2021). - DOI - PubMed
    1. Saranyutanon, S., Srivastava, S. K., Pai, S., Singh, S. & Singh, A. P. Therapies targeted to androgen receptor signaling axis in prostate cancer: Progress, challenges, and hope. Cancers (Basel). 12, 51. 10.3390/cancers12010051 (2019). - DOI - PMC - PubMed
    1. Rawla, P. Epidemiology of prostate cancer. World J. Oncol.10, 63–89. 10.14740/wjon1191 (2019). - DOI - PMC - PubMed
    1. Bahnassy, A. A., Abdellateif, M. S. & Zekri, A. N. Cancer in Africa: is it a genetic or environmental health problem? Front. Oncol.10, 604214. 10.3389/fonc.2020.604214 (2020). - DOI - PMC - PubMed
    1. Hinata, N. & Fujisawa, M. Racial differences in prostate cancer characteristics and cancer-specific mortality: an overview. World J. Mens Health. 40, 217–227. 10.5534/wjmh.210070 (2022). - DOI - PMC - PubMed

LinkOut - more resources