. 2025 Feb 13;8(1):224.
doi: 10.1038/s42003-025-07640-9.

Metabolic profiling of two white-rot fungi during 4-hydroxybenzoate conversion reveals biotechnologically relevant biosynthetic pathways

Affiliations

Metabolic profiling of two white-rot fungi during 4-hydroxybenzoate conversion reveals biotechnologically relevant biosynthetic pathways

Lummy Maria Oliveira Monteiro et al. Commun Biol. .

Abstract

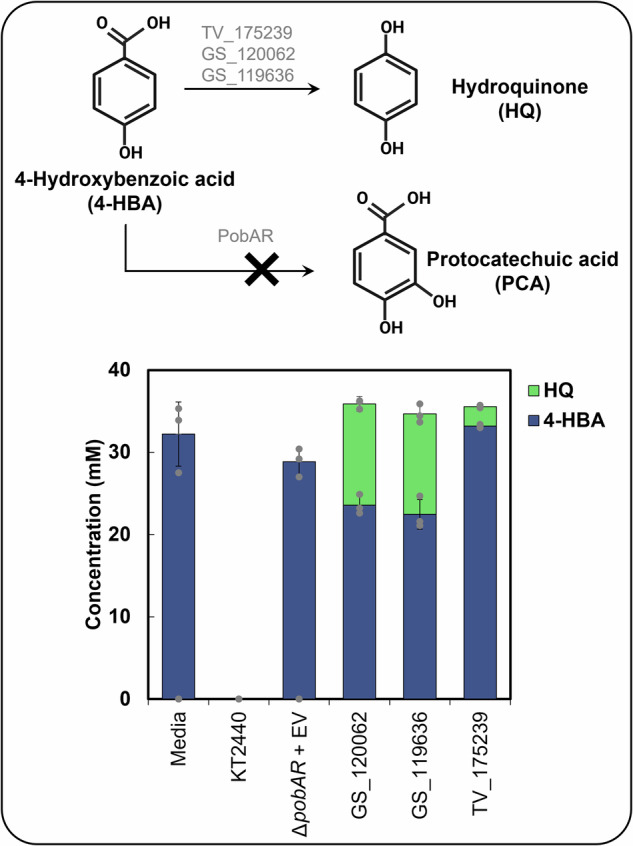
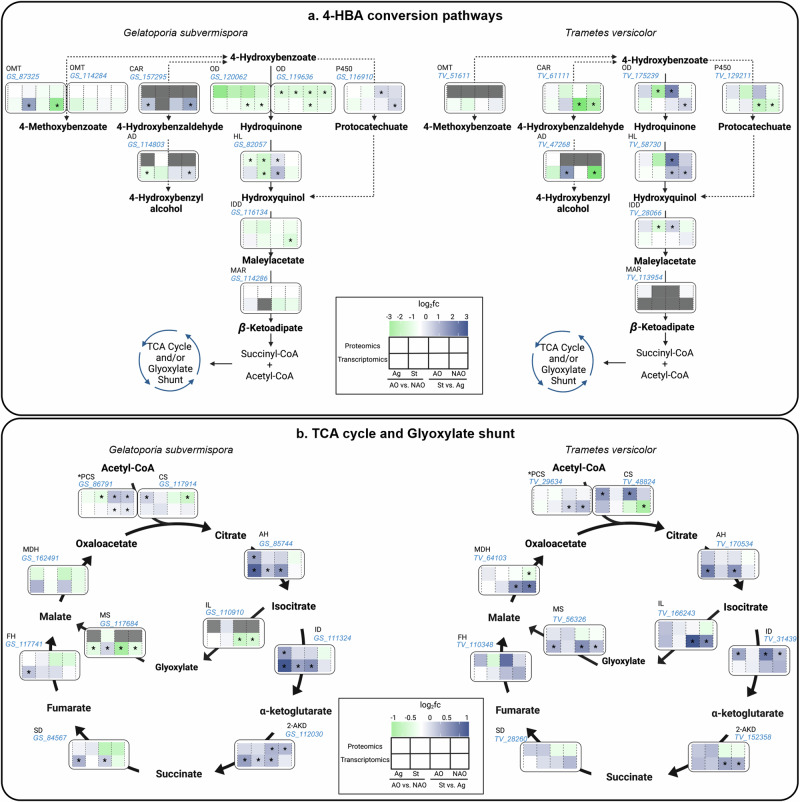
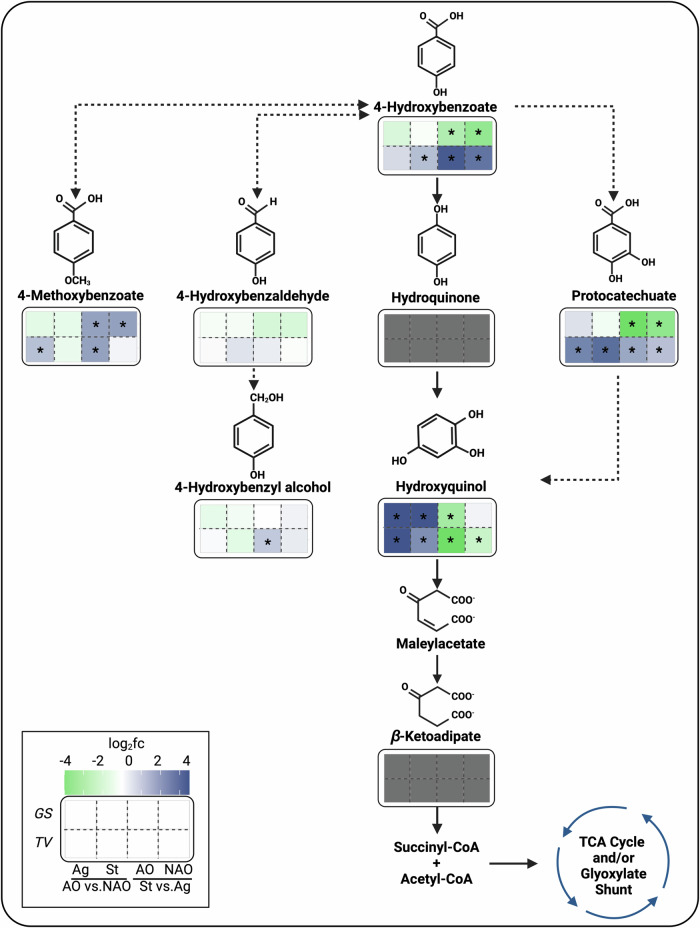
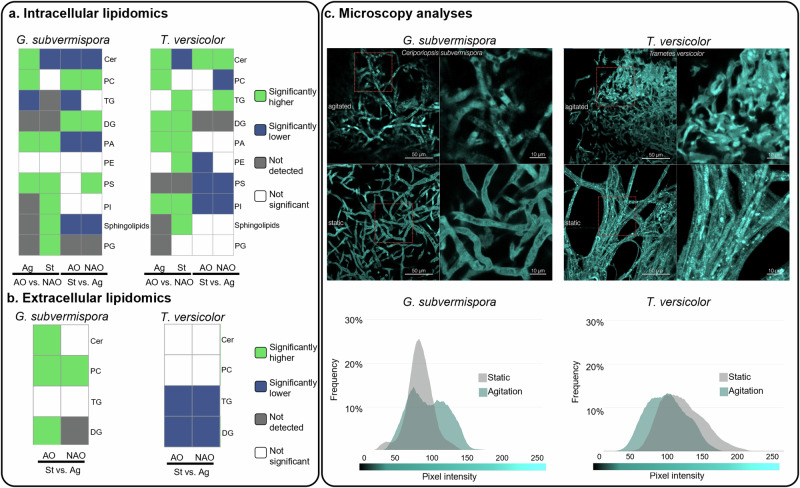
White-rot fungi are efficient organisms for the mineralization of lignin and polysaccharides into CO2 and H2O. Despite their biotechnological potential, WRF metabolism remains underexplored. Building on recent findings regarding the utilization of lignin-related aromatic compounds as carbon sources by WRF, we aimed to gain further insights into these catabolic processes. For this purpose, Trametes versicolor and Gelatoporia subvermispora were incubated in varying conditions - in static and agitation modes and different antioxidant levels - during the conversion of 4-hydroxybenzoic acid (a lignin-related compound) and cellobiose. Their metabolic responses were assessed via transcriptomics, proteomics, lipidomics, metabolomics, and microscopy analyses. These analyses reveal the significant impact of cultivation conditions on sugar and aromatic catabolic pathways, as well as lipid composition of the fungal mycelia. Additionally, this study identifies biosynthetic pathways for the production of extracellular fatty acids and phenylpropanoids - both products with relevance in biotechnological applications - and provides insights into carbon fate in nature.


Conflict of interest statement

Competing interests: The authors declare no competing interests.

Figures

Fig. 1
Fig. 1. Functional validation of oxidative decarboxylases from WRF in the bacterium P. putida KT2440.
The figure shows 4-hydroxybenzoic acid (4-HBA) conversion to hydroquinone (HQ) by WRF and to protocatechuic acid by P. putida KT2440, as well as metabolite concentrations in the supernatant of cultivations conducted with engineered P. putida expressing oxidative decarboxylases from G. subvermispora (GS) and T. versicolor (TV). Bars represent the average concentration from biological triplicates and error bars show the standard deviation. Dot-plots depict individual data points. Media = abiotic media; KT2440= wild-type P. putida; ΔpobAR + EV = P. putida KT2440 with pobAR knockout and empty vector.
Fig. 2
Fig. 2. Conversion of cellobiose and 4-hydroxybenzoic acid (4-HBA) in the extracellular fractions in different cultivation conditions by WRF.
(ac) G. subvermispora (GS) and (df) T. versicolor (TV) profiles. (a and d) Cellobiose concentration overtime, (b and e) glucose concentration overtime, (c and f) 4-HBA concentration after its addition in the cultivations and total conversion levels after 24 h. Data show averages from three biological replicates. Error bars represent standard deviation. Dot-plots depict individual data points. AO ascorbic acid and α-tocopherol antioxidants, NAO no antioxidants.
Fig. 3
Fig. 3. Transcriptomic and proteomic profiles of G. subvermispora and T. versicolor of 4-HBA catabolic pathways, TCA cycle, and glyoxylate shunt under different cultivation conditions.
Transcriptomic and proteomic profiles of enzymes involved in (a) 4-HBA conversion and (b) the TCA cycle, and the glyoxylate shunt in G. subvermispora and T. versicolor. Heatmaps associated to each biochemical step display log2fold changes of relative enzyme (top row) and transcripts (bottom row) abundances in four pairwise comparisons (from left to right): AO vs. without AO (NAO) in agitation, AO vs NAO in static conditions, static vs. agitation with AO, and static vs. agitation without AO. Green is indicative of a negative log2fold change (negative induction) while dark blue is indicative of a positive log2fold change (positive induction) in the corresponding pairwise comparison. Gray boxes indicate that the protein or gene did not return triplicate transcripts or peptides in upstream analyses. Asterisks (*) within the heatmap boxes indicate significant differences in those pairwise comparisons, determined via Tukey’s Honest Significant Difference test. Discontinuous arrow lines are non-validated biochemical reactions but included based on systems biology observations in del Cerro et al. (2021). Protein IDs (in blue) are also shown for each biochemical step abbreviated as (in alphabetic order): 2-AKD 2-alpha ketoglutarate dehydrogenase, AH aconitate hydratase, CAR carboxylic acid reductase, CS citrate synthase, FH fumarate hydratase, HL hydroxylase, ID isocitrate dehydrogenase, IDD intradiol dioxygenase, IL isocitrate lyase, MAR maleylacetate reductase, MDH malate dehydrogenase, MS malate synthase, OD oxidative decarboxylase, PCS peroxisomal citrate synthase, P450 cytochrome P450, SD succinate dehydrogenase. Other abbreviations: AO ascorbic acid and α-tocopherol antioxidants, NAO no antioxidants. Omics results originate from three biological replicates for each cultivation condition.
Fig. 4
Fig. 4. Intracellular metabolomic profiles for various 4-HBA conversion pathways in T. versicolor and G. subvermispora.
Heatmaps below each metabolite display log2fold changes of relative metabolite abundance in four pairwise comparisons (from left to right): AO vs. without AO (NAO) in agitation (Ag), AO vs NAO in static (St) conditions, St vs. Ag with AO, and St vs. Ag without AO. G. subvermispora (GS) is shown in the top row and T. versicolor (TV) in the bottom row. Green and dark blue colors are indicative of a negative and positive log2fold change, respectively, in each pairwise comparison. Asterisks (*) within heatmap boxes show significant differences in pairwise comparisons, confirmed by a Tukey’s honest significant difference test. A metabolite is considered as present if detected in at least three biological replicates. Gray boxes indicate the metabolite is not detected. Molecules without heatmaps do not have commercially available standards. Continuous and discontinuous black lines correspond to validated and proposed enzymatic steps, respectively. Metabolomics results originate from three biological replicates for each cultivation condition. AO ascorbic acid and α-tocopherol antioxidants, NAO no antioxidants, Ag agitation, St static, GS G. subvermispora, TV T. versicolor.
Fig. 5
Fig. 5. Proposed phenylpropanoid biosynthetic pathway in T. versicolor.
a Metabolomic analysis in the extracellular milieu of T. versicolor for a group of mass features including cinnamic acid, p-coumaric acid, caffeic acid, ferulic acid, phenylalanine, and tyrosine. The heatmap, represented by the log10 of peak heights, shows relative metabolite abundances from cultivations conducted in different conditions. A metabolite is considered present if it is detected in at least three biological replicates. Data originated from three biological replicates. b Intracellular proteomic analysis showing log10 concentrations of putative enzymes of the proposed phenylpropanoid biosynthetic pathway. Reference enzymes for each reaction (from 1 to 10) are color-coded to highlight their origins:blue for plants, red for bacteria, and yellow for yeast. This heatmap represents the same conditions as in section A. Data originated from three biological replicates. c Proposed phenylpropanoid biosynthetic pathway in T. versicolor. The quantification of identified metabolites in the extracellular fraction is shown in bar graphs and the results derive from averages of biological duplicates. Error bars indicate the absolute difference between the biological duplicates. Dot-plots depict individual data points. The enzymes of each reaction are: Reaction 1:PAL L-phenylalanine ammonia-lyase, PTAL bifunctional L-phenylalanine/L-tyrosine ammonia-lyase, reaction 2:C4H cinnamate 4-hydroxylase, 3:C3H 4-coumarate 3-hydroxylase, reaction 4:Fcs feruloyl-CoA synthase, reaction 5:Ech enoyl-CoA hydratase/lyase, reaction 6:Vdh vanillin dehydrogenase, reaction 7:3-oxoacyl-(acyl-carrier protein) reductase, reaction 8: 3-oxoacyl CoA thiolase, reaction 9:Alpha/beta hydrolase family, reaction 10: COMT caffeate/5-hydroxyferulate 3-O-methyltransferase. Ag agitation, AO antioxidants, NAO no antioxidants, St static;controls:AOt0 = Time zero control (with seed media from T. versicolor), AOtn = 7-day control (with seed media from T. versicolor), NAOt0 = Time zero control (without seed media), NAOtn = 5-day control (without seed media), (no seed) NAOTn = 7-day control (without seed media and without antioxidants). Supplementary Data 6 includes source data underlying charts of Fig. 5c.
Fig. 6
Fig. 6. Intracellular and extracellular lipidomic profiles and visualization of G. subvermispora and T. versicolor mycelia under different cultivation conditions.
Summary of the (a) intracellular and (b) extracellular lipid classes detected in different cultivation conditions. The heatmaps associated with each lipid class are the results from pairwise comparisons, from left to right: are agitation with antioxidants (AO) vs. agitation without AO (NAO), static cultivation with AO vs. static without AO, static with AO vs. agitation with AO, and static without AO vs. agitation without AO. Green indicates that the feature is significantly higher, while blue indicates that the feature is significantly lower based on the pairwise analyses. Only statistically significant results are displayed in the heatmaps (at least 80% of the statistically significant features, evaluated by log2 fold change and confirmed by Tukey’s Honest Significant Difference test, are in one group or another). Gray boxes indicate the lipid class was not detected, and white boxes indicate no significant difference between the compared groups (< 80%). These -omic results originate from three biological replicates for each cultivation condition. c Microscopy images of G. subvermispora and T. versicolor mycelia stained with BODIPY-ceramide stain to highlight ceramide/sphingolipids patterns (top) and intensity of the staining (bottom). Scale bars= 50 µm (left) 10 µm. Ag agitation, AO antioxidants, NAO no antioxidants, St static; and for the lipid features: Cer Ceramides, DG Diradylglycerols, PA Glycerophosphates, PC Glycerophosphocholines, PE Glycerophosphoethanolamines, PG Glycerophosphoglycerols, PI Glycerophosphoinositols, PS Glycerophosphoserines, Sphingolipids Phosphosphingolipids, TG Triradylglycerols.

References

    1. Boerjan, W., Ralph, J. & Baucher, M. Lignin biosynthesis. Annu. Rev. Plant Biol.54, 519–546 (2003). - PubMed
    1. Zakzeski, J., Bruijnincx, P. C., Jongerius, A. L. & Weckhuysen, B. M. The catalytic valorization of lignin for the production of renewable chemicals. Chem. Rev.110, 3552–3599 (2010). - PubMed
    1. Floudas, D. et al. The paleozoic origin of enzymatic lignin decomposition reconstructed from 31 fungal genomes. Science336, 1715–1719 (2012). - PubMed
    1. Martínez, A. T. et al. Biodegradation of lignocellulosics: microbial, chemical, and enzymatic aspects of the fungal attack of lignin. Int. Microbiol.8, 195–204 (2005). - PubMed
    1. Erickson, E. et al. Critical enzyme reactions in aromatic catabolism for microbial lignin conversion. Nat. Catal.5, 86–98 (2022).

Supplementary concepts