. 2025 Feb 12;16(1):1195.
doi: 10.1038/s41467-025-56260-8.

Atypical hippocampal excitatory neurons express and govern object memory

Affiliations

Atypical hippocampal excitatory neurons express and govern object memory

Adrienne I Kinman et al. Nat Commun. .

Abstract

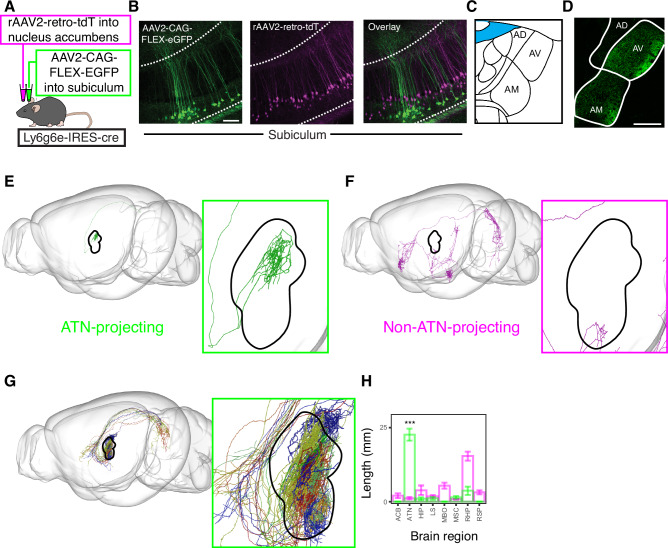
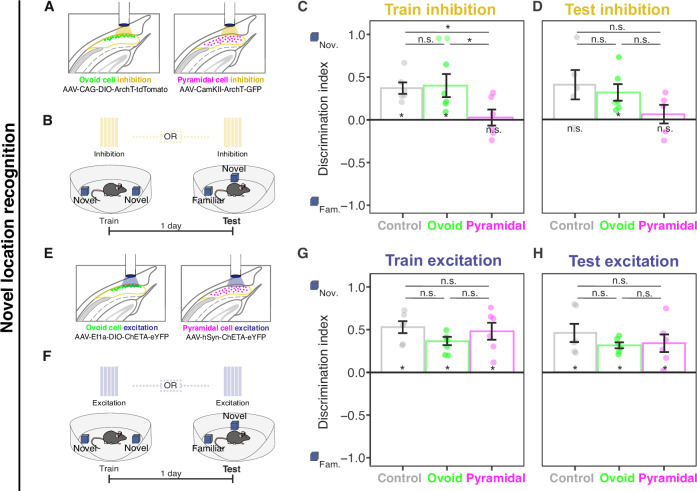
Classically, pyramidal cells of the hippocampus are viewed as flexibly representing spatial and non-spatial information. Recent work has illustrated distinct types of hippocampal excitatory neurons, suggesting that hippocampal representations and functions may be constrained and interpreted by these underlying cell-type identities. In mice, here we reveal a non-pyramidal excitatory neuron type - the "ovoid" neuron - that is spatially adjacent to subiculum pyramidal cells but differs in gene expression, electrophysiology, morphology, and connectivity. Functionally, novel object encounters drive sustained ovoid neuron activity, whereas familiar objects fail to drive activity even months after single-trial learning. Silencing ovoid neurons prevents non-spatial object learning but leaves spatial learning intact, and activating ovoid neurons toggles novel-object seeking to familiar-object seeking. Such function is doubly dissociable from pyramidal neurons, wherein manipulation of pyramidal cells affects spatial assays but not non-spatial learning. Ovoid neurons of the subiculum thus illustrate selective cell-type-specific control of non-spatial memory and behavioral preference.


Conflict of interest statement

Competing interests: The authors declare no competing interests.

Figures

Fig. 1
Fig. 1. Identification of a non-pyramidal excitatory neuron type in the subiculum.
A scRNA-seq landscape of putative excitatory neurons, with cells colored according to cluster identity and visualized via UMAP dimensionality reduction. B Expression of control genes (top row) and cluster-specific genes (bottom row) for clusters from (A). Results are shown via violin plot, wherein left tick mark denotes zero, and right tick mark denotes maximum value in counts per million (CPM). C Cluster-specific mean values of gene expression for all genes. Differentially expressed genes are colored according to their enriched cluster. D Atlas schematic of a coronal section of the dorsal subiculum. E Expression of Slc17a7 via chromogenic in situ hybridization. Scale bar: 500 µm. Image from Allen Mouse Brain Atlas. F, G As in (E), but for the cluster-specific marker genes Ly6g6e and Cck. H Expression of Slc17a7, Ly6g6e, and Cck via FISH, with inset illustrating expansion of shown region. Independently repeated across 7 sections from 3 animals. Scale bars: 100 µm overview, 10 µm inset. I Summary of cellular phenotypes for the image in (H). Black denotes non-Slc17a7-expressing cells. J Summary of cellular phenotype distribution for all excitatory cells examined (n = 142,209 total cells; with n = 73,861 Slc17a7-expressing putative excitatory neurons). K Combined Nissl and FISH. Arrows denote phenotype of individual cells. Independently repeated across 2 sections from 2 animals. Scale bar: 10 µm. L Representative cell-body segmentations in yellow. M Cell-body areas for Ly6g6e-expressing and Cck-expressing cells (n = 301 total cells, with n = 102 and 199 total Ly6g6e-expressing and Cck-expressing neurons from n = 2 animals; p = 4.3e-2 via two-sided paired t-test on within-animal-averaged data). Data are presented as mean values ± SEM. N Schematic illustrating calculation of aspect ratios registered to the alveus for the two cells from (L). O As in (M), but for alveus-oriented aspect ratios (p = 4.3e-2 via two-sided paired t-test on within-animal-averaged data). Data are presented as mean values ± SEM. P Principal component analysis of cell-body properties, with points colored according to phenotype from marker gene expression. Cluster 1 (Ly6g6e-expressing) phenotype: 116 cells; cluster 2 (Cck-expressing) phenotype: 185 cells.
Fig. 2
Fig. 2. Ovoid neurons exhibit specialized long-range axonal targets.
A Schematic of subtype-specific labeling strategy in Ly6g6e-IRES-Cre mouse line. B Representative image of viral expression in the subiculum for strategy in (A). Note that images are oriented so that primary apical dendrites of pyramidal cells extend upwards. Independently repeated across 2 sections from 4 animals. Scale bar: 100 µm. C Atlas illustrating the anterior thalamic nuclei (ATN). D Representative projections to the anterior thalamic nuclei for CAG-FLEX-EGFP injection scheme shown in (A). Scale bar: 300 µm. E Axonal reconstruction of a single subiculum neuron projecting to the ATN. F As in (E), but for a single neuron with projections elsewhere. G Axonal reconstructions for downstream brain regions. H Axonal length in downstream brain regions (72 non-ATN-projecting cells, 12 ATN-projecting cells, p = 1.9E-12, two-sided Mann-Whitney U test). Data are presented as mean values ± SEM. ACB Nucleus Accumbens, ATN Anterior Thalamic Nuclei, HIP Hippocampal Region, LS Lateral Septal Nucleus, MBO Mammillary Body, MSC Medial Septal Complex, RHP Retrohippocampal Region, RSP Retrosplenial Area.
Fig. 3
Fig. 3. Ovoid neurons have specialized dendritic architectures.
A Representative subiculum cell bodies for neurons labeled by the viral scheme in Fig. 2A; i.e., by Cre-dependent eGFP into Ly6g6e-cre mouse (green) along via retrograde-labeled neurons projecting to the nucleus accumbens (magenta). Scale bar: 20 µm. B Summary of cell-body properties for neurons labeled by scheme in (A). Data points are averages of individual animals (n = 57 ovoid cells and n = 58 pyramidal cells from n = 5 animals for each cell type, width: p = 4.2e-1; height: p = 7.9e-3; area: 3.2e-2; aspect ratio: p = 7.9e-3, two-sided Mann-Whitney U test). Data are presented as mean values ± SEM. C Representative image of labeled neurons for the viral scheme shown in (A). Scale bar: 50 µm. D Expansion around primary apical dendrite of an ovoid neuron. Scale bar: 2 µm. E Representative single-cell morphologies of ATN-projecting putative ovoid neurons (green, top row) and nucleus accumbens-projecting pyramidal neurons (magenta, bottom row). Morphologies obtained via Janelia Mouselight Project. F Dendritic properties of single-cell ATN-projecting putative ovoid neurons (green, top row) and nucleus accumbens-projecting putative pyramidal neurons (magenta, bottom row). Data points are individual neurons (number of branches: p = 6.8e-9; length: p = 3.6e-4, n = 23 ovoid cells and n = 48 pyramidal cells, two-sided Mann-Whitney U test). Data are presented as mean values ± SEM. Morphologies obtained via Janelia Mouselight Project.
Fig. 4
Fig. 4. Ovoid neurons have heightened excitability, consistent with specialized morphology.
A Left: Ovoid cell morphology from ex vivo whole-cell recording. Inset provides expanded cell body. B As in (A), but for pyramidal cells. Inset shows bursting. C Input resistances for ovoid neurons, regular spiking pyramidal neurons, and burst spiking pyramidal neurons (n = 75 ovoid cells, n = 24 regular spiking pyramidal cells, n = 28 burst spiking pyramidal cells, n = total 67 animals; ovoid vs. regular spiking pyramidal p = 6.1e-8, ovoid vs. burst spiking pyramidal p = 6.1e-8, regular spiking pyramidal vs. burst spiking pyramidal p = 5.9e-3, Kruskal-Wallis test on averaged data from individual animals). Data points are averages from individual animals and data are presented as mean values ± SEM. D As in (C), but for rheobase of cells (ovoid vs. pyramidal regular spiking p = 1.9e-6, ovoid vs. burst spiking pyramidal p = 3.9e-5, regular spiking pyramidal vs. burst spiking pyramidal p = 1.4e-1, Kruskal-Wallis test). E Input-output curves for ovoid and pyramidal neurons, with regular spiking and bursting neurons pooled for pyramidal neurons (n = 71 ovoid, n = 70 pyramidal cells, n = 67 animals; 0pA p = 1, 20pA p = 2.4e-2, 40pA p = 2.7e-7, 60pA p = 9.7e-10, 80pA p = 1.0e-9, 100pA p = 1.1e-10 on averaged data from individual animals, two-sided Mann-Whitney U test). Data are presented as mean values ± SEM. F Left: Reconstructed morphology of an ovoid neuron used for simulation. Right: action potential firing for ovoid neuron following current injection. Scale bars: 20 mV and 250 ms. G As in (F), but for a pyramidal neuron, with radial oblique dendrites colored in violet. Overlaid traces depict simulations with radial obliques (“normal morphology”) and without radial obliques (“obliqueless”). H Input resistances for modeled ovoid neurons (n = 9), pyramidal neurons with radial obliques (“normal morphology”, n = 10), and pyramidal neurons without radial oblique dendrites (“obliqueless”, n = 10). Data points are individual modeled neurons and data are presented as mean values ± SEM.
Fig. 5
Fig. 5. Selective responses to novel objects in ovoid cells.
A Viral and imaging strategy for assessing activity in ovoid neurons (top) and pyramidal neurons (bottom) with 1-photon calcium imaging, with approximate GRIN lens placement. B Example fields of view with background-removed activity maps (left) as well as maximum projections with extracted segmented cells (right), for both ovoid cells (top row) and pyramidal cells (bottom row). Scale bar: 100 µm. This was independently repeated 12 times. C Example calcium traces for ovoid neurons (top) and pyramidal neurons (bottom) taken during exploration in the novel object-encoding session. Scale bar: 10 s, with y-axis having arbitrary units. D Schematic of novel object recognition paradigm. E Object-interaction-triggered ovoid neuron activity for novel and familiar object interactions, for a representative animal undergoing the behavioral paradigm illustrated in (D). Vertical black line at 0 denotes start of interaction with an object, with individual lines illustrating averaged activity of all segmented individual cells within the field of view for the session. F As in (E), but for a representative animal assessing pyramidal cell activity. G Depiction of classification of responder cells, wherein cells must reach a minimum ΔZ of 0.25 for a minimum of 10 s following object interactions. H The percentage of cells that classify as a responder cell for novel (red) and familiar (blue) objects, for ovoid cells (left) and pyramidal cells (right). Data points represent individual animals (n = 6 animals for each of ovoid and pyramidal conditions, ovoid: p = 3.1e-3, pyramidal: p = 0.48, two-sided linear model, no adjustment for multiple comparisons) and data are presented as mean values ± SEM.
Fig. 6
Fig. 6. Optogenetic manipulation of ovoid cells toggles object preference.
A Viral strategy for targeting ovoid (left) and pyramidal cells (right). B Novel object recognition and optogenetic inhibition. C Discrimination indices on test day for inhibition occurring during training session (n = 7 control, n = 7 ovoid, n = 7 pyramidal; ovoid vs. pyramidal p = 0.25, ovoid vs. control p = 0.012, pyramidal vs. control p = 0.06, Kruskal-Wallis test; training inhibition from 0, control p = 0.031, ovoid p = 0.29, pyramidal p = 0.078, two-sided Mann-Whitney U test). Data are presented as mean values ± SEM. D As in (C), but for inhibition during testing (n = 7 control, n = 6 ovoid, 7 pyramidal; ovoid vs. pyramidal p = 0.20, ovoid vs. control p = 8.2e-3, pyramidal vs. control p = 0.20, Kruskal-Wallis test; test inhibition from 0, control p = 0.031, ovoid p = 0.031, pyramidal p = 0.016, two-sided Mann-Whitney U test). E, F As in (A, B), but for ChETA-based ovoid neuron excitation during training, assessing encoding. G, H As in (C, D), but for excitation during testing, assessing short-term retrieval (n = 7 control, n = 7 ovoid, n = 6 pyramidal; Training excitation: ovoid vs. control p = 0.82, ovoid vs. pyramidal p = 0.44, control vs. pyramidal p = 0.72; train excitation from 0, control p = 0.02, ovoid p = 7.8e-3, pyramidal p = 0.022. Test excitation: ovoid vs. control p = 1.5e-2, ovoid vs. pyramidal p = 2.4e-3, control vs. pyramidal p = 0.35, Kruskal-Wallis test; test excitation from 0, control p = 0.031, ovoid p = 7.8e-3, pyramidal p = 0.031, two-sided Mann-Whitney U test). I, J As in (E, F), but for excitation assessing long-term retrieval, occurring 50 days after initial encoding, as well as a subsequent non-excitation retrieval test. K Discrimination indices for preferences during stimulation test day and non-stimulation test day for long-term retrieval (n = 6 control, n = 6 ovoid; p = 8.7e-3, Kruskal-Wallis test; test excitation from 0, test excitation p = 0.031, test non-excitation p = 0.44, two-sided Mann-Whitney U test). Data are presented as mean values ± SEM.
Fig. 7
Fig. 7. Optogenetic inhibition of pyramidal cells impairs spatial learning while ovoid inhibition spares spatial learning.
A Viral strategy for targeting ovoid (left) and pyramidal cells (right). B Novel location recognition and optogenetic paradigm for ArchT-based inhibition. C Discrimination indices on test day for inhibition occurring during training session (n = 6 control, n = 7 ovoid, n = 6 pyramidal; Training inhibition: pyramidal vs. ovoid p = 0.045, pyramidal vs. control p = 0.031, ovoid vs. control p = 0.81, Kruskal-Wallis test; training inhibition from 0, controls p = 0.031, ovoid p = 0.031, pyramidal p = 0.56, two-sided Mann-Whitney U test). Data are presented as mean values ± SEM. D As in (C), but for inhibition during testing (n = 6 control, n = 7 ovoid, n = 6 pyramidal; test inhibition: pyramidal vs. ovoid p = 0.41, pyramidal vs. control p = 0.095, ovoid vs. control p = 0.52, Kruskal-Wallis test; test inhibition from 0, control p = 0.13, ovoid p-value p = 0.031, pyramidal p = 0.63, two-sided Mann-Whitney U test). Data are presented as mean values ± SEM. EH as in (AD) but for the ChETA-based ovoid neuron excitation during novel location recognition (n = 6 control, n = 7 ovoid, n = 6 pyramidal; Training excitation: control vs. ovoid p = 0.066, control vs. pyramidal p = 0.81, ovoid vs. pyramidal p = 0.23, Kruskal-Wallis test; train excitation from 0, control p = 0.031, ovoid p = 0.031, pyramidal p = 0.031, two-sided Mann-Whitney U test. Test excitation: control vs. ovoid p = 0.52, control vs. pyramidal p = 0.58, ovoid vs. pyramidal p = 1, Kruskal-Wallis test; test excitation from 0, control p = 0.031, ovoid p = 0.031, pyramidal p = 0.031, two-sided Mann-Whitney U test). Data are presented as mean values ± SEM.

References

    1. O’Keefe, J. & Nadel, L. The Hippocampus as a Cognitive Map (Oxford University Press, 1978).
    1. Aronov, D., Nevers, R. & Tank, D. W. Mapping of a non-spatial dimension by the hippocampal-entorhinal circuit. Nature543, 719–722 (2017). - PMC - PubMed
    1. Manns, J. R., Howard, M. W. & Eichenbaum, H. Gradual changes in hippocampal activity support remembering the order of events. Neuron56, 530–540 (2007). - PMC - PubMed
    1. McKenzie, S. et al. Hippocampal representation of related and opposing memories develop within distinct, hierarchically organized neural schemas. Neuron83, 202–215 (2014). - PMC - PubMed
    1. Knudsen, E. B. & Wallis, J. D. Hippocampal neurons construct a map of an abstract value space. Cell184, 4640–4650.e4610 (2021). - PMC - PubMed

LinkOut - more resources