. 2025 Mar;22(3):579-591.
doi: 10.1038/s41592-024-02580-4. Epub 2025 Feb 12.

Segment Anything for Microscopy

Affiliations

Segment Anything for Microscopy

Anwai Archit et al. Nat Methods. 2025 Mar.

Erratum in

  • Author Correction: Segment Anything for Microscopy.
    Archit A, Freckmann L, Nair S, Khalid N, Hilt P, Rajashekar V, Freitag M, Teuber C, Spitzner M, Tapia Contreras C, Buckley G, von Haaren S, Gupta S, Grade M, Wirth M, Schneider G, Dengel A, Ahmed S, Pape C. Archit A, et al. Nat Methods. 2025 Jul;22(7):1603. doi: 10.1038/s41592-025-02745-9. Nat Methods. 2025. PMID: 40490528 Free PMC article. No abstract available.

Abstract

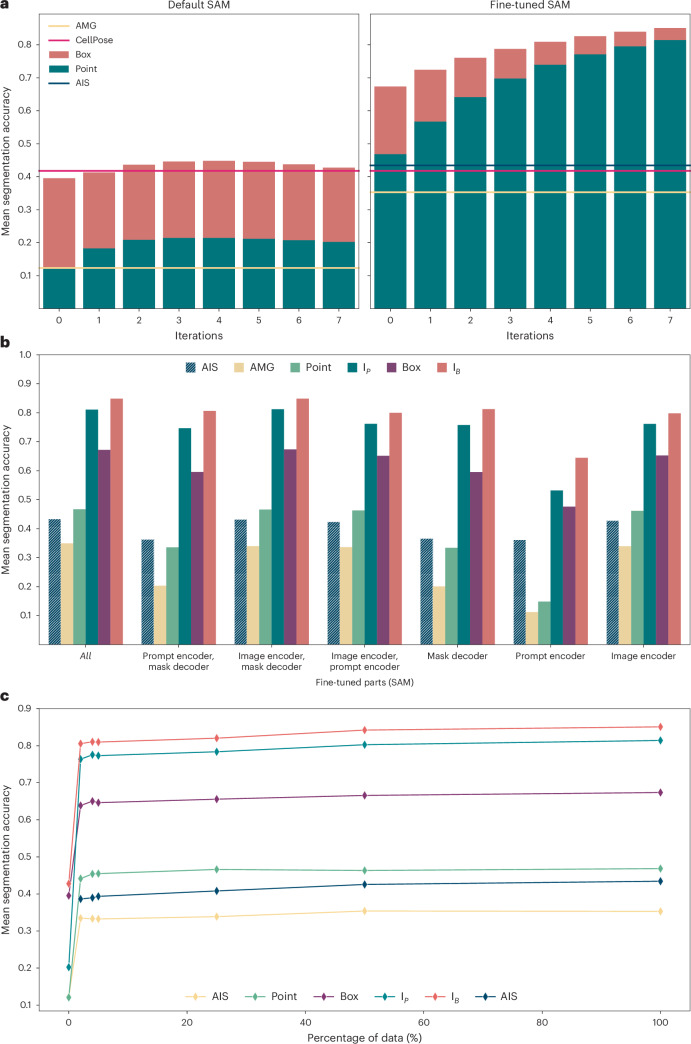
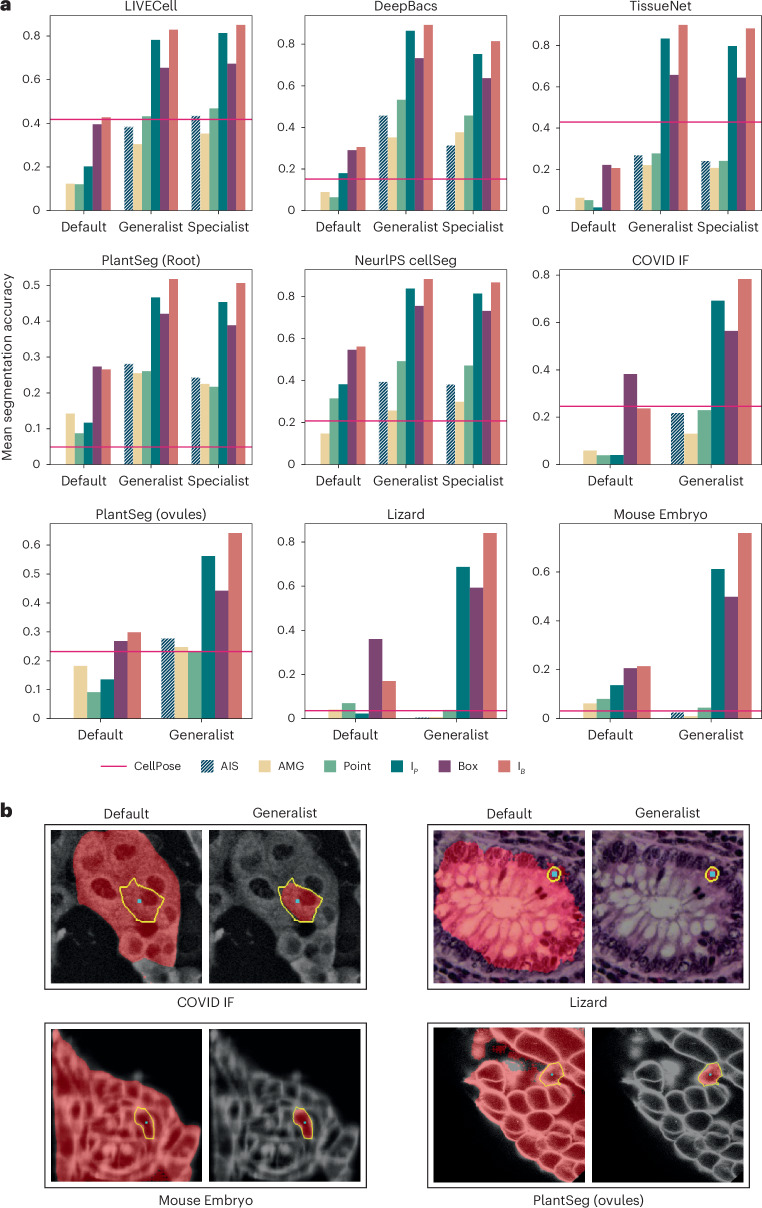
Accurate segmentation of objects in microscopy images remains a bottleneck for many researchers despite the number of tools developed for this purpose. Here, we present Segment Anything for Microscopy (μSAM), a tool for segmentation and tracking in multidimensional microscopy data. It is based on Segment Anything, a vision foundation model for image segmentation. We extend it by fine-tuning generalist models for light and electron microscopy that clearly improve segmentation quality for a wide range of imaging conditions. We also implement interactive and automatic segmentation in a napari plugin that can speed up diverse segmentation tasks and provides a unified solution for microscopy annotation across different microscopy modalities. Our work constitutes the application of vision foundation models in microscopy, laying the groundwork for solving image analysis tasks in this domain with a small set of powerful deep learning models.


Conflict of interest statement

Competing interests: The authors declare no competing interests.

Figures

Fig. 1
Fig. 1. Overview of μSAM.
a, We provide a napari plugin for segmenting multidimensional microscopy data. This tool uses SAM, including our improved models for LM and EM (see b). It supports automatic and interactive segmentation as well as model retraining on user data. The drawing sketches a complete workflow based on automatic segmentation, correction of the segmentation masks through interactive segmentation and model retraining based on the obtained annotations. Individual parts of this workflow can also be used on their own, for example, only interactive segmentation can be used as indicated by the dashed line. b, Improvement of segmentation quality due to our improved models for LM (top) and EM (bottom). Blue boxes or blue points show the user input, yellow outlines show the true object and red overlay depicts the model prediction.
Fig. 2
Fig. 2. Results on LIVECell.
a, Comparison of the default SAM with our fine-tuned model. The bar plot shows the mean segmentation accuracy for interactive segmentation, starting from a single annotation, either a single positive point (green) or a box (red). We then iteratively add a pair of point annotations, one positive, one negative, derived from prediction errors to simulate interactive annotation. The lines indicate the performance for automated instance segmentation methods—AMG (yellow), AIS (dark green) and CellPose (red)—using a CellPose model trained on LIVECell. Evaluation is performed on the test set defined in the LIVECell publication. b, Comparison of partial model fine-tuning. The x axis indicates which part(s) of the model are updated during training: the image encoder, the mask decoder and/or the prompt encoder. We evaluate AIS (dark green, striped), AMG (yellow), segmentation from a single point annotation (light green, corresponding to the green bar at iteration 0 in a), from iterative point annotations IP (green, corresponding to the green bar at iteration 7 in a), from a box annotation (magenta, corresponding to the red bar at iteration 0 in a) and from a box annotation followed by correction with iterative point annotations IB (red, corresponding to the red bar at iteration 7 in a). Training the image encoder has the biggest impact and fine-tuning all model parts yields the best overall results. c, Evolution of segmentation quality for increasing size of the training dataset, using the same evaluation and color coding as in b. All results in this figure use a model based on ViT-L. Extended Data Fig. 1 explains the model parts and shows results for models of different sizes.
Fig. 3
Fig. 3. Generalist LM model.
a, Comparison of the default SAM with our generalist and specialist models. We use the same evaluation procedure as in Fig. 2b,c. The red line indicates the performance of CellPose (specialist models for LIVECell and TissueNet, cyto2 model otherwise). Datasets LIVECell, DeepBacs, TissueNet, PlantSeg (root) and NeurIPS CellSeg are part of the training set (evaluated on a separate test split) and datasets COVID IF, PlantSeg (ovules), Lizard and Mouse Embryo contain image settings not directly represented in training. b, Qualitative segmentation results with the default SAM and our LM generalist model. The cyan dot indicates the point annotation, the yellow outline highlights the true object and the red overlay represents the model prediction.
Fig. 4
Fig. 4. EM model.
a, Comparison of the default SAM and our EM generalist that was trained to improve mitochondrion and nucleus segmentation. Of the nine datasets, MitoEM (rat), MitoEM (human) and Platynereis (nuclei) are part of the training set (evaluation is done on separate test splits), while the others are not. We follow the same evaluation procedure as before. We provide the results of MitoNet (red line) as a reference for automatic mitochondrion segmentation. All experiments are done in 2D. b, Qualitative comparisons of segmentation results with default SAM and our EM generalist, using the same color coding as in Fig. 3b.
Fig. 5
Fig. 5. Inference and training in resource-constrained settings.
a, Runtimes for computing embeddings, running AIS and AMG (per image) and segmenting an object via point or box annotation (per object) on a CPU (Intel Xeon, 16 cores) and GPU (Nvidia RTX5000, 16 GB VRAM). We run AIS, AMG, point and box annotation with precomputed embeddings. We report the average runtime for 10 different images for Embeddings, AIS and AMG, measuring the runtime for each image five times and taking the minimum. For Point and Box, we report the average runtime per object, averaged over the objects in 10 different images. b, Improvements due to fine-tuning a ViT-B model when training on 1, 2, 5 or 10 images of the COVID IF dataset on the CPU (same CPU as in a). We compare using the default SAM and our LM generalist model as starting points and evaluate the segmentation results on 36 test images (not part of any of the training sets). We use early stopping. Dotted lines indicate results obtained with LoRA using a rank of 4. Otherwise all model parameters are updated, as in previous experiments; we refer to this as full fine-tuning (FFT) in the caption. See Extended Data Fig. 10d for training times of different hardware setups. Note that we use the segmentation accuracy evaluated at an intersection over union (IOU) threshold of 50%, as the metric here, because we found that mean segmentation accuracy was too stringent for the small objects to meaningfully compare improvements. c, Qualitative automatic segmentation results before and after fine-tuning on 10 images for the default SAM (comparing AMG before and AIS after fine-tuning) and our LM generalist (comparing AIS before and after fine-tuning).
Fig. 6
Fig. 6. User studies of the μSAM annotation tools.
a, Segmentation of organoids imaged in brightfield microscopy with μSAM, CellPose and manual annotation. We compare different models for μSAM and CellPose; see the text and Methods for details. We report the average annotation time per object, quality of annotations when compared to consensus annotations and segmentation quality evaluated on a separate test dataset. All experiments are done by five annotators and errors correspond to standard deviations over annotator results. The entries ‘μSAM (LM generalist)’ and ‘CellPose (default)’ in the ‘mSA (test)’ column are obtained from evaluating the initial models; the other results in this column are obtained from evaluating models trained on user annotations. The two images on the right compare the automated segmentation result (without correction) obtained from ‘μSAM (default)’ and ‘μSAM (fine-tuned)’. b, Segmentation of nuclei in volume EM. The table compares the average annotation time per object for μSAM, using a default model and a model fine-tuned for this data, with ilastik carving. For the fine-tuned model, we start annotation from an initial 3D segmentation provided by the model; otherwise, we annotate each object interactively. The image below shows the result after correction for the fine-tuned model. c, Tracking of nuclei in fluorescence microscopy. The table lists the average annotation time per track for μSAM, using three different models, and TrackMate, as well as the tracking quality, measured by the tracking accuracy score (TRA). For μSAM, each lineage is tracked interactively; ‘fine-tuned’ is trained specifically for this data. TrackMate provides an automatic tracking result, based on nucleus segmentation from StarDist, which is then corrected. The image below illustrates the tracking annotation obtained with μSAM (fine-tuned).
Extended Data Fig. 1
Extended Data Fig. 1. SAM Architecture and extended LIVECell results.
SAM architecture and extended results on LIVECell. a. SAM takes the image and object annotations as input and predicts mask(s) and IOU score(s). The image encoder computes the embeddings, which are independent of the annotations, the prompt encoders encode the mask, point and/or box annotations and the mask decoder predicts the output mask(s) and score(s). In the case of annotation with a single point, the model predicts three potential output masks to deal with ambiguity; for example predicting the individual object highlighted by the point in the example or also predicting the objects touching it. The predicted score gives the confidence for the correctness of the mask. b. Results for SAM (default and fine-tuned) on LIVECell with different image encoder sizes (ViT-T, ViT-B, ViT-L, ViT-H). We use the same experimental set-up as in Fig. 2a. The black error bars indicate the standard deviation over five independent runs of the interactive segmentation evaluation procedure. Note that this procedure includes randomness because it samples prompts to correct the segmentation masks according to segmentation errors from previous iterations. c. Training on reduced LIVECell datasets for all image encoder sizes; same experimental set-up as Fig. 2c with different image encoder sizes.
Extended Data Fig. 2
Extended Data Fig. 2. Extended quantitative evaluation for light microscopy models.
Comparison of default SAM, LM generalist, and specialist models as well as CellPose. Same experimental set-up as in Fig. 3a, but we compare on additional datasets and report the results for all image encoder sizes (a - d). See Supplementary Table 1 for dataset references.
Extended Data Fig. 3
Extended Data Fig. 3. Qualitative interactive segmentation results for light microscopy I.
Qualitative comparison of interactive segmentation for the default SAM and our LM generalist. For both the model based on ViT-L is used. Cyan shows the input point or box annotation, yellow the correct object and red the model prediction. We select examples with the best improvement in IOU score of the generalist compared to the default model to highlight typical improvements. The most consistent improvement is that the generalist correctly segments individual cells in clusters, whereas the default model segments the whole cluster. This figure serves to give an impression of how the interactive segmentation is improved; the quantitative improvement can be seen in Fig. 3a and Sup. Figure 2.
Extended Data Fig. 4
Extended Data Fig. 4. Qualitative interactive segmentation results for light microscopy II.
Qualitative comparison of interactive segmentation for the default SAM and our LM generalist (ViT-L). Opposite approach to Extended Data Fig. 3: we show the objects where the decrease in IOU is largest comparing the generalist and default model. Here, we see a few different effects: in some cases the generalist model segments several nearby cells (proving an exception to the general behavior observed previously) for point annotations, in other cases the segmentation quality is lower because the generalist segments smaller sub-structures. This systematic effect can also be observed for Covid IF, where the generalist often segments only the nucleus, which is discernible from the rest of the cell, rather than the full cell. Note that the quantitative segmentation quality for all these datasets is clearly higher for the generalist model as shown in Fig. 3 and Extended Data Fig. 2.
Extended Data Fig. 5
Extended Data Fig. 5. Extended quantitative evaluation for electron microscopy models.
Comparison of the default SAM and our EM generalist, with MitoNet as reference for automatic mitochondrion segmentation. We use the same experimental set-up as in Fig. 3 but give results for all image encoder sizes (a - d) and additional datasets. Note that the datasets Sponge EM and Platynereis (Cilia) evaluate segmentation for cilia and microvilli, which the generalist models were not trained for. They still yield improved results (except for segmentation with a single point prompt). See Supplementary Table 2 for dataset references.
Extended Data Fig. 6
Extended Data Fig. 6. Qualitative interactive segmentation results for electron microscopy I.
Qualitative comparison of interactive segmentation for the default SAM and our EM generalist (ViT-L). Cyan shows the input point or box annotation, yellow the correct object and red the model prediction. We select examples with the best improvement from the generalist model (see also Extended Data Fig. 3). The generalist model overall adheres better to the object boundaries and for single point annotations segments the selected organelle instead of the surrounding compartment. It also avoids segmenting touching objects. This figure serves to give an impression of how the interactive segmentation is improved; the quantitative improvement can be seen in Fig. 4a and Extended Data Fig. 5.
Extended Data Fig. 7
Extended Data Fig. 7. Qualitative interactive segmentation results for electron microscopy II.
Qualitative comparison of interactive segmentation for the default SAM and our EM generalist (ViT-L). Opposite approach to Extended Data Fig. 6: we show the objects with the largest disadvantage for the generalist model (see also Extended Data Fig. 4). Note that the quantitative segmentation quality for all these datasets is better with the generalist as shown in Fig. 4 and Extended Data Fig. 5.
Extended Data Fig. 8
Extended Data Fig. 8. Segmentation results for neuron and other organelle segmentation in electron microscopy.
Segmentation of other structures in EM. a. Segmentation of neurites in EM using the CREMI dataset. We compare the default SAM, our EM generalist and a specialist model. The specialist is fine-tuned starting from default SAM on a separate training split; the models are evaluated on the same test split; the evaluation is in 2D and follows the usual approach. The images below compare qualitative results for interactive segmentation with the three models. All models are based on ViT-L. We see that the generalist overall decreases the segmentation quality for this task because it was trained to segment organelles rather than membrane compartments like neurites. Only interactive segmentation after correction (IP and IB) is improved, which can be partly explained by the effect discussed in Supplementary Fig. 1. The specialist model clearly improves the segmentation results across all settings. b. Endoplasmic reticulum (ER) segmentation. We follow the same strategy as in a, but for segmenting ER instead of neurites, using the ASEM dataset from Gallusser et al.. Here, we somewhat surprisingly observe that the two smaller models (ViT-T, ViT-B) perform better than the two larger models in some settings. Annotation quality with a single point and AMG quality decrease for the generalist compared to the default model, but annotation with a box improves or does not change much (depending on the model). Interactive segmentation (IP and IB) improves. In summary the generalist does not have a clear advantage over the default model. Training a specialist, with the default model as starting point, improves results in all settings compared to the default model and is better than or on par with the generalist in almost all settings, except for interactive segmentation with ViT-T and ViT-B.
Extended Data Fig. 9
Extended Data Fig. 9. Volumetric segmentation results.
Interactive and automatic 3D segmentation. a. Quantitative evaluation for interactive and automatic segmentation with default SAM and the LM generalist for cell segmentation (left) / the default SAM and the EM generalist (right); using the ViT-B models. We use a confocal microscopy volume from PlantSeg (Ovules) / a FIBSEM volume from Lucchi et al. for the experiments. For interactive segmentation we derive a single prompt in the middle slice per object and then run our interactive volumetric segmentation approach based on projecting prompts to adjacent slices. For automatic segmentation we use the slice by slice segmentation approach, followed by merging of segments across slices. We report the result for AIS with our generalist models; 3D segmentation via AMG is too inefficient to run it here. We report the SA50 metrics (segmentation accuracy at an IOU of 50%) because we found that mean segmentation accuracy is too stringent for these 3D segmentation problems. b. 2D and 3D visualizations of the results for automatic segmentation for both datasets.
Extended Data Fig. 10
Extended Data Fig. 10. Model finetuning in resource-constraint settings.
Resource constrained finetuning. a. Improvement of different segmentation settings with training epochs for finetuning ViT-T,B,L,H on LIVECell. We train for 100,000 iterations, otherwise using the same settings as in Fig. 2a. We see that the majority of improvements happen early, motivating the use of early stopping in resource constrained settings. b. Influence of the number of objects per image used during finetuning, which is the most important training hyperparameter and also determines the VRAM required for training. The experiments are for a ViT-B trained for 100,000 iterations on LIVECell with 1-45 objects per image and we show evaluations for the usual segmentation settings. We see that increasing the number of objects initially strongly improves results and then plateaus or improves results with a smaller slope. c. Best hyperparameter settings for the hardware configurations we have tested. For each configuration we first looked if training ViT-L is possible (only for A100), using ViT-B otherwise, then how many objects could fit. For A100 we use a batch size of 2 and for all other settings a batch size of 1. For the GTX 1080 it is not possible to fine-tune the full ViT-B model and it is only possible to fine-tune mask decoder (MD) and prompt encoder (PD), which limits the model improvements, see also Fig. 2b. d Training times in epochs and minutes for finetuning models on Covid IF (Supplementary Fig. 4) using the different hardware configurations and best settings according to c, when updating all weights (Full FT) or using parameter-efficient training (LoRA) We use early stopping after 10 epochs without improvement and start training either from the default model or LM generalist.

References

    1. Stringer, C., Wang, T., Michaelos, M. & Pachitariu, M. Cellpose: a generalist algorithm for cellular segmentation. Nat. Methods18, 100–106 (2021). - PubMed
    1. Greenwald, N. F. et al. Whole-cell segmentation of tissue images with human-level performance using large-scale data annotation and deep learning. Nat. Biotechnol.40, 555–565 (2022). - PMC - PubMed
    1. Schmidt, U., Weigert, M., Broaddus, C. & Myers, G. Cell detection with star-convex polygons. Lect. Notes Comput. Sci.11071, 265–273 (2018).
    1. Vergara, H. M. et al. Whole-body integration of gene expression and single-cell morphology. Cell184, 4819–4837 (2021). - PMC - PubMed
    1. Conrad, R. & Narayan, K. Instance segmentation of mitochondria in electron microscopy images with a generalist deep learning model trained on a diverse dataset. Cell Syst.14, 58–71 (2023). - PMC - PubMed

LinkOut - more resources