. 2025 Mar;639(8053):232-240.
doi: 10.1038/s41586-024-08532-4. Epub 2025 Feb 12.

UM171 glues asymmetric CRL3-HDAC1/2 assembly to degrade CoREST corepressors

Affiliations

UM171 glues asymmetric CRL3-HDAC1/2 assembly to degrade CoREST corepressors

Megan J R Yeo et al. Nature. 2025 Mar.

Abstract

UM171 is a potent agonist of ex vivo human haematopoietic stem cell self-renewal1. By co-opting KBTBD4, a substrate receptor of the CUL3-RING E3 ubiquitin ligase (CRL3) complex, UM171 promotes the degradation of the LSD1-CoREST corepressor complex, thereby limiting haematopoietic stem cell attrition2,3. However, the direct target and mechanism of action of UM171 remain unclear. Here we show that UM171 acts as a molecular glue to induce high-affinity interactions between KBTBD4 and HDAC1/2 to promote corepressor degradation. Through proteomics and chemical inhibitor studies, we identify the principal target of UM171 as HDAC1/2. Cryo-electron microscopy analysis of dimeric KBTBD4 bound to UM171 and the LSD1-HDAC1-CoREST complex identifies an asymmetric assembly in which a single UM171 molecule enables a pair of KELCH-repeat propeller domains to recruit the HDAC1 catalytic domain. One KBTBD4 propeller partially masks the rim of the HDAC1 active site, which is exploited by UM171 to extend the E3-neosubstrate interface. The other propeller cooperatively strengthens HDAC1 binding through a distinct interface. The overall CoREST-HDAC1/2-KBTBD4 interaction is further buttressed by the endogenous cofactor inositol hexakisphosphate, which acts as a second molecular glue. The functional relevance of the quaternary complex interaction surfaces is demonstrated by base editor scanning of KBTBD4 and HDAC1. By delineating the direct target of UM171 and its mechanism of action, we reveal how the cooperativity offered by a dimeric CRL3 E3 can be leveraged by a small molecule degrader.


Conflict of interest statement

Competing interests: B.B.L. is a cofounder, shareholder and member of the scientific advisory board of Light Horse Therapeutics. N.Z. is one of the scientific cofounders and a shareholder of SEED Therapeutics. N.Z. serves as a member of the scientific advisory board of Synthex, Molecular Glue Labs and Differentiated Therapeutics with financial interests. R.M. and N.C.P. are listed as inventors on patent applications related to the CoraFluor TR-FRET probes used in this work. P.A.C. is a co-founder of Acylin Therapeutics and a consultant for Abbvie regarding p300 acetyltransferase inhibitors. L.B.-P. is a founder, consultant and holds privately held equity in Scorpion Therapeutics. R.M. is a scientific advisory board member and equity holder of Regenacy Pharmaceuticals. S.A.C. is a member of the scientific advisory boards of Kymera, PTM BioLabs, Seer and PrognomIQ. The other authors declare no competing interests.

Figures

Fig. 1
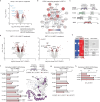
Fig. 1. UM171-induced degradation of CoREST depends on HDAC1/2 interaction.
a, The chemical structure of UM171. b, Whole-proteome quantification in SET-2 cells treated with DMSO (n = 3) or 1 µM UM171 (n = 3) for 6 h. The coloured dots show proteins with |log2[fold change]| > 0.5 and P < 0.01 in UM171 treatment. The blue and red dots depict proteins that are enriched or absent in LSD1 co-IP–MS, respectively. c, Immunoblot analysis of SET-2 cells treated with UM171 (1 µM) or DMSO for the indicated duration. d, Global ubiquitination site quantification (K-ε-GG peptides) in SET-2 cells treated with DMSO (n = 3) or 1 µM UM171 (n = 3) for 90 min. The red dots show sites with adjusted P < 0.05 (after Benjamini–Hochberg correction for multiple comparisons). Owing to sequence homology between the HDAC1/2 paralogues, several peptides corresponding to either HDAC1 or HDAC2 could not be definitely assigned (Supplementary Data 4–6). e, Schematic of corepressor constructs fused in-frame with GFP followed by an internal ribosome entry site (IRES) and mCherry stability reporter. f,h, Flow cytometry quantification of MOLM-13 cells treated with DMSO or UM171 for 24 h and expressing the indicated CoREST–GFP reporter (f) and the indicated corepressor–GFP reporter (h). g, Immunoblots of HA IP from 293T cells transfected with HA–KBTBD4 and the indicated CoREST–FLAG construct and treated with UM171 (1 µM) or DMSO for 1 h and MLN4924 (1 µM) for 3 h. The results in c and fh are representative of two independent experiments. For f and h, data are mean ± s.d. of n = 3 biological replicates. P values were calculated using two-tailed unpaired t-tests for the indicated comparisons (f and h) and two-sided empirical Bayes-moderated t-tests (b and d). FACS gating schemes and uncropped blots are shown in Supplementary Figs. 1a and 2, respectively. HA, hemagglutinin; IP, immunoprecipitation; MW, molecular weight. Source data
Fig. 2
Fig. 2. HDAC1 mediates LHC–UM171–KBTBD4 ternary complex formation.
ac,e, Flow cytometry quantification of K562 CoREST–GFP cells that were transduced with the indicated sgRNAs (LSD1 (a) and HDAC1 and HDAC2 (b)) after treatment with DMSO or UM171 (1 µM) for 24 h (a,b), K562 HDAC1-null HDAC2–dTAG CoREST–GFP cells after treatment with dTAG-13 (500 nM) or DMSO for 2 h followed by either UM171 (1 µM) or DMSO for 24 h (c), and K562 CoREST–GFP cells treated with the indicated HDAC inhibitors (10 µM) for 12 h followed by UM171 (1 µM) for 24 h (e). P values were calculated using two-tailed unpaired t-tests for the indicated comparisons. d, FLAG IP immunoblot analysis of K562 cells expressing FLAG–KBTBD4 and treated with UM171 (5 µM), SAHA (10 µM), or DMSO, and MLN4924 (1 µM). f, FP of JL1 with KBTBD4 in the presence or absence of LHC or LSD1–CoREST (L–C) and InsP6 (50 µM). n = 3 biological replicates. g, Quantification of LHC deacetylase activity on H3K9ac-modified mononucleosomes in the presence or absence of UM171 (10 µM) and/or KBTBD4. n = 2 biological replicates. See also Extended Data Fig. 3f. h, The TR-FRET signal between fluorescein–LHC and anti-His CoraFluor-1-labelled antibody with His–KBTBD4 in the presence of varying concentrations of UM171. n = 2 biological replicates. i, CoREST immunoblot analysis of in vitro ubiquitination assays of CRL3KBTBD4 with fluorescein–LHC in the presence of DMSO or UM171 (10 µM). n = 3 biological replicates. For ac and e, data are mean ± s.d. of n = 3 biological replicates and are representative of two independent experiments. For d, f and h, data are representative of two independent experiments. FACS gating schemes and uncropped blots are shown in Supplementary Figs. 1b and 3, respectively. Corr., corrected; FP, fluorescence polarization; MW, molecular weight; NS, not significant. Source data
Fig. 3
Fig. 3. The overall structure of the KBTBD4–UM171–HDAC1–CoREST complex.
a, Two orthogonal views of HDAC1 (pink) and CoREST-bound (orange) KBTBD4 (green/slate) with UM171 (space-filling model in yellow and blue) and InsP6 (space-filling model in green and red). b, Schematic of the protein domains of KBTBD4. c, The BTB and BACK domains as a cartoon representation and the KELCH-repeat domain as a surface representation of a KBTBD4 protomer (green) in the KBTBD4 dimer. The N-terminal region of the other protomer with the domain-swapped β1-strand flanked by the ENYF motif and an α-helix is shown in slate. Helices that are predicted to bind to CUL3 are indicated as 3-box. d, The KELCH-repeat β-propeller domain of KBTBD4 with its secondary structure elements annotated. e, Flow cytometry quantification of K562 KBTBD4-null CoREST–GFP cells overexpressing the indicated KBTBD4 variants after treatment with DMSO or UM171 for 24 h. Data are mean ± s.d. of n = 3 technical replicates and are representative of two independent experiments. f, The overall architectures of the LHC–UM171-bound and apo forms of the KBTBD4 homodimer. The closest distance between the two KELCH-repeat domains and the widest dimension of the E3 dimer in the two forms are indicated at the top and bottom of the dimers, respectively. FACS gating strategies are shown in Supplementary Fig. 1c. Source data
Fig. 4
Fig. 4. UM171 and InsP6 establish a bimolecular glue interface.
a, The interface between the 4b–4c β-hairpin of KBTBD4-A (slate) and HDAC1 (pink). The side chains of the interacting amino acids are shown as sticks. b, Flow cytometry quantification of K562 KBTBD4-null CoREST–GFP cells overexpressing the indicated KBTBD4 variants after treatment with DMSO or UM171 for 24 h. Data are mean ± s.d. of n = 3 technical replicates. c, View of the interface formed between KBTBD4-B (green) and HDAC1 (pink), with UM171 shown as yellow and blue sticks and InsP6 shown as green, orange and red sticks. Secondary structures involved in protein–protein interactions are annotated. d, Comparison of UM171 (yellow and blue sticks) with SAHA (orange, blue and red sticks) binding to the active-site pocket of HDAC1 (pink surface), with zinc (Zn) shown as a slate sphere based on the HDAC2–SAHA structure (Protein Data Bank (PDB): 4LXZ) superimposed with HDAC1. e, Magnified view of UM171 (yellow and blue sticks) binding to the surface pocket formed between KBTBD4-B (green) and HDAC1 (pink). Side chains of select UM171-contacting residues are shown as sticks. f, Magnified view of the interactions made by InsP6 (red, orange and green sticks) to KBTBD4-B (green), HDAC1 (pink) and CoREST (orange); residues involved in the interactions are highlighted as sticks. Potential salt bridges and hydrogen bonds are shown as dashed lines. g, The normalized TR-FRET signal between fluorescein–LHC and anti-His CoraFluor-1-labelled antibody with His–KBTBD4 in the presence of varying concentrations of InsP6 and UM171. n = 2 biological replicates. For b and g, data are representative of two independent experiments. FACS gating schemes are shown in Supplementary Fig. 1c. Source data
Fig. 5
Fig. 5. Base editing functionally maps the KBTBD4–UM171–HDAC1/2 interface.
a, Schematic of base editor scanning of HDAC1 (428 out of 482 residues; 88.6%) and KBTBD4 (460 out of 534 residues; 86.1%) in K562 CoREST–GFP cells. The diagram was adapted from ref. . b, The log2[fold change in sgRNA enrichment] in GFP+ cells versus unsorted cells treated with 1 µM UM171 (n = 3) for 24 h for base editor scanning of HDAC1 using a cytidine base editor (left) and adenosine base editor (right). The dotted lines represent ±4 s.d. from the mean of non-targeting controls (n = 199). Selected sgRNAs are labelled. c, The structure of HDAC1–CoREST–KBTBD4 showing HDAC1 residues coloured on the basis of linear clustering score from base editor scanning (Extended Data Fig. 8d). The Cα positions of selected top-enriched sgRNAs, marked in b, shown as spheres. Padj, adjusted P. d, Immunoblots of HA–KBTBD4 IP from clonal 293T cell lines containing the indicated HDAC1 base edits, transfected with HA–KBTBD4, and treated with DMSO or UM171 (1 µM) for 1 h and MLN4924 (1 µM) for 3 h. The base editing genotypes are shown in Extended Data Fig. 9a. Data are representative of two independent experiments. e, The log2[fold change in sgRNA enrichment] in GFP+ cells versus unsorted cells treated with 1 µM UM171 (n = 3) for 24 h for base editor scanning of KBTBD4 using a cytidine base editor (left) and adenosine base editor (right). The dotted lines represent ±4 s.d. from the mean of non-targeting controls (n = 199). Selected sgRNA hit positions are labelled. f, The structure of HDAC1–CoREST–KBTBD4, showing KBTBD4-B residues coloured on the basis of the linear clustering score from base editor scanning (the same colour scale as in c; Extended Data Fig. 8d). The Cα positions of selected top-enriched sgRNAs, marked in e, are shown as spheres. FACS-gating schemes and uncropped blots are shown in Supplementary Figs. 1d and 4, respectively. HA, hemagglutinin; IP, immunoprecipitation; MW, molecular weight.
Extended Data Fig. 1
Extended Data Fig. 1. Supporting data for Fig. 1.
a, Whole-proteome quantification in MV4;11 cells treated with DMSO (n = 3) or 1 µM UM171 (n = 3) for 6 h. Coloured dots show proteins with |log2(fold-change)| > 0.5 in UM171 versus DMSO treatment and P value < 0.01. Blue and red dots depict proteins enriched or absent in LSD1 co-IP/MS, respectively. b, STRING network of proteins enriched in LSD1 co-IP/MS in SET-2 cells. Colour scale depicts log2(fold-change) in UM171 treatment. c, Protein domain maps of CoREST (RCOR1), RCOR2, RCOR3, and MIER1. d, Whole-proteome quantification in SET-2 cells treated with DMSO (n = 3) or 1 µM UM171 (n = 3) for 1.5 h (left) and 6 h (right). Red dots show proteins with adjusted P value < 0.05 (Benjamini–Hochberg correction for multiple comparisons). e, Differential enrichment of selected ubiquitination Lys sites highlighted in Fig. 1d. Colour indicates row min and max values. Due to sequence homology between HDAC paralogues, several peptides corresponding to either HDAC1 or HDAC2 could not be definitely assigned (see Supplementary Data 4–6). f-h, Flow cytometry quantification of MOLM-13 cells expressing the indicated CoREST–GFP reporter treated with DMSO or UM171 for 24 h. Signal is normalized to DMSO treatment for each CoREST construct. In f (right), Pymol alpha-fold structure of HDAC1-CoREST with key positions and Zn highlighted. Data are mean ± s.d. of n = 3 biological replicates and representative of two independent experiments, and P values were calculated through two-tailed unpaired t tests for the comparisons indicated. For data in a and d, P values were calculated using two-sided empirical Bayes-moderated t tests. FACS-gating schemes are in Supplementary Fig. 1a. Source data
Extended Data Fig. 2
Extended Data Fig. 2. Supporting cell line model data for Fig. 2.
a, Immunoblots in wild-type K562 CoREST–GFP knock-in cells and a clonal cell line with KBTBD4 knockout treated with DMSO or UM171 (1 µM) for 6 h. b, Flow cytometry for GFP signal in K562 CoREST–GFP cells treated with DMSO (green) or 1 µM UM171 (grey) for 6 h. Gate was determined where 1% of the DMSO condition are considered FITC. c,d, Immunoblots in K562 CoREST–GFP cells after transduction of the indicated sgRNAs. e, Immunoblots showing CoREST–GFP, HDAC1, and HDAC2 in K562 HDAC1-null and HDAC2-null CoREST–GFP clonal cell lines. f, Allele frequency analysis for K562 CoREST–GFP HDAC1-null (top) and HDAC2-null (bottom) clonal cell lines. Genotyping was performed once. g, Immunoblots showing HDAC2–dTAG and GAPDH in K562 CoREST–GFP HDAC1-null HDAC2–dTAG cells treated with DMSO or dTAG-13 (500 nM) for 2 h. Data in a-e, and g are representative of two independent experiments. FACS-gating schemes and uncropped blots are in Supplementary Figs. 1b, 5, respectively. KO, knock out; MW, molecular weight.
Extended Data Fig. 3
Extended Data Fig. 3. Supporting biochemistry data for Fig. 2.
a, Relative enzyme activity for indicated HDAC in the presence of varying concentrations of the indicated compounds. b, Chemical structure of JL1. c, Immunoblots for K562 cells treated with UM171 or JL1 at indicated concentrations for 24 h. d, Fluorescence polarization of JL1 with KBTBD4 and LHC in the presence of varying concentrations of SAHA or UM171 (n = 2 biological replicates). e, Fluorescence polarization of JL1 with KBTBD4 and InsP6 in the presence or absence of indicated proteins (n = 3 biological replicates). f, Immunoblots for in vitro deacetylation assays of LHC with H3K9ac modified mononucleosomes staining with antibodies for H3K9ac and total H3 under the indicated conditions. All timepoints for a given experimental condition were run on a single gel. All samples across conditions were derived from the same experiment and were run in parallel. g, TR-FRET signal between anti-His CoraFluor-1-labelled antibody with His-KBTBD4 and varying concentrations of fluorescein-LHC in the presence of DMSO or 10 µM UM171 (n = 2 biological replicates). KD values of the LHC-KBTBD4 interactions in the absence and presence of UM171 are 351 nM and 13 nM, respectively. h, Microscale thermophoresis of fluorescein-LHC with varying concentrations of KBTBD4 in the presence and absence of 50 µM UM171 (n = 2 biological replicates). i, Coomassie staining for in vitro ubiquitination assays of CRL3KBTBD4 with fluorescein-LHC in the presence of DMSO or UM171 (10 µM). j, Immunoblots for HDAC1 (left) and LSD1 (right) for in vitro ubiquitination assays of CRL3KBTBD4 with fluorescein-LHC in the presence of DMSO or UM171 (10 µM). Data in a, c, e, and g are representative of two independent experiments. Data in f are representative of n = 2 biological replicates. Results in i and j are representative of n = 3 biological replicates. Uncropped blots can be found in Supplementary Fig. 6. Corr., corrected; MW, molecular weight. Source data
Extended Data Fig. 4
Extended Data Fig. 4. Cryo-EM data processing for the KBTBD4-UM171-LHC complex.
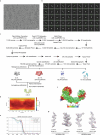
a, A representative cryo-EM micrograph out of 10,637 micrographs; scale bar 50 nm. b, Typical 2D averages of the cryo-EM dataset. c, The flowchart of single particle analysis of the KBTBD4-UM171-LHC complex. d, The angular distribution of particles used in the final reconstruction. e, Fourier shell correlation (FSC) curves for KBTBD4-UM171-LHC. At the Gold-standard threshold of 0.143, the resolution is 3.77–3.86 Å. f, Local resolution map of the KBTBD4-UM171-LHC complex from 2.5 to 4.5 Å. g, Density maps of representative regions of the KBTBD4-UM171-LHC complex fit with the structural model shown in sticks.
Extended Data Fig. 5
Extended Data Fig. 5. Cryo-EM data processing for the apo form of KBTBD4.
a, A representative cryo-EM micrograph out of 10,057 micrographs; scale bar 50 nm. b, Typical 2D averages of the cryo-EM dataset. c, The flowchart of single particle analysis of the apo KBTBD4 complex. d, The angular distribution of particles used in the final reconstruction. e, Fourier shell correlation (FSC) curves for KBTBD4. At the Gold-standard threshold of 0.143, the resolution is 3.83 Å. f, Local resolution map of the KBTBD4 apo dimer from 2.5 to 4.5 Å. g, Density maps of representative regions of the homo-dimeric KBTBD4 complex fit with the structural model shown in sticks.
Extended Data Fig. 6
Extended Data Fig. 6. Sequence alignment and structural annotation of KBTBD4.
Sequence alignment of five vertebrate KBTBD4 orthologues (Hs: Homo sapiens, Mm: Mus musculus, Gg: Gallus gallus, Xt: Xenopus tropicalis, Dr: Danio rerio) with secondary structure annotations. The sequences of the BTB, BACK and KELCH-repeat domains are underlined in different colours (slate, salmon, and purple). The residues interacting with HDAC1 are labelled with “#”; the residues interacting with InsP6 are labelled with “•”; and the residues interacting with UM171 are labelled with “*”. Strictly conserved residues are coloured in blue.
Extended Data Fig. 7
Extended Data Fig. 7. Structural analysis of the KBTBD4-LHC-UM171 complex.
a, Top view of the KBTBD4 dimer with chain A coloured in slate and chain B coloured in green in pseudo-two-fold symmetry. b, Superposition of KBTBD4 chain A (slate) with chain B (green). c, Superposition of the protomers in the LHC-bound and the apo forms of the KBTBD4 dimer. d, Superposition of HDAC1 bound to KBTBD4 (pink) versus bound to MTA1 (cyan, PDB: 4BKX). e, Close-up view of the HDAC1 (pink) region remodelled by the 4b-4c β-hairpin (slate) of the KBTBD4-A (slate surface) versus HDAC1 (cyan) bound to MTA1 (PDB: 4BKX). f, Superposition comparison of the 2b-2c loop of KBTBD4-B (green) occupying the active-site of HDAC1 (pink) with the histone H4 K16Hx peptide (orange sticks) (PDB: 5ICN). g, Close-up view of the UM171 (yellow sticks) along with its density (dark grey mesh) at the interface between HDAC1 (pink) and KBTBD4-B (green). h, Close-up view of the surface complementarity among KBTBD4-B (green), HDAC1 (pink), and UM171 (yellow and blue spheres). i, Close-up view of UM171 (yellow and blue sticks) binding to the active-site pocket of HDAC1 (pink). Important residues demarcating the active-site of HDAC1 are shown in sticks with zinc (Zn) shown in slate sphere. Potential hydrogen bonds are shown in dashed lines. j, Superposition comparison of the HDAC1-binding modes between UM171 and the histone H4 K16Hx peptide (PDB:5ICN). k, Close-up view of UM171(yellow and blue sticks) binding to the surface of KBTBD4-B (green). The side chains of key UM171-contacting residues are shown in sticks. l, Superposition comparison of the UM171 binding region in KBTBD4-B (green) and the corresponding region in KBTBD4-A (slate surface). Residues involved in UM171 binding in KBTBD4-B and their corresponding residues in KBTBD4-A are highlighted in sticks. m, Close-up view of InsP6 (red, orange, and green sticks) with its density map (dark grey coloured mesh) at the tri-molecular junction among KBTBD4-B (green), HDAC1 (pink) and CoREST (orange).
Extended Data Fig. 8
Extended Data Fig. 8. Base editor scanning of HDAC1 and KBTBD4.
a, Immunoblot of HA IP from 293T cells transfected with FLAG–HDAC1 and HA–KBTBD4 and treated with UM171 (1 µM), SAHA (10 µM), or DMSO for 1 h and MLN4924 (1 µM) for 3 h. b, Flow cytometry quantification in K562 HDAC1-null and HDAC2-null CoREST–GFP cells treated with DMSO (white) or 1 µM UM171 (pink) for 24 h. Bars represent mean ± s.d. of n = 3 biological replicates. c, Box plots of log2(fold-change sgRNA enrichment) for HDAC1 and KBTBD4 cytidine base editor (CBE) and adenosine base editor (ABE) scanning. sgRNAs classified by predicted editing outcome and the number of sgRNAs are indicated. Box plots show the median and interquartile range, with whiskers extending to 1.5× the interquartile range. Outliers are shown individually. Data are mean of n = 3 biological replicates. d, Line plots showing −log10(adjusted P values, P) for the observed per-residue sgRNA enrichment scores for (left) HDAC1 and (right) KBTBD4 coding sequences. The dotted line corresponds to P = 0.05 and residues with P ≤ 0.05 are highlighted in red. Data in a and b are representative of two independent experiments. FACS-gating schemes and uncropped blots are in Supplementary Fig. 1b, 7, respectively. KO, knock out; UTR, untranslated region; HA, hemagglutinin; IP, immunoprecipitation; MW, molecular weight. Source data
Extended Data Fig. 9
Extended Data Fig. 9. Genotyping and validation of HDAC1/2 base edits by individual sgRNA transductions.
a, Allele frequency analysis for 293T clonal cell lines after base editing of HDAC1 with the indicated sgRNAs and SpG ABE8e or SpG CBE. Only alleles with ≥1% allele frequency in at least one sample are shown. Protein product sequences are shown with nonsynonymous mutations in red. Genotyping was performed once. b, Top: allele frequency analysis after base editing of HDAC1 in K562 HDAC2-null cells with sgE203 and ABE8e. Bottom: allele frequency analysis after base editing of HDAC2 in K562 HDAC1-null cells with sgE204 and ABE8e. Only alleles with ≥1% allele frequency in at least one sample are shown. Protein product sequences are shown with nonsynonymous mutations in red. Genotyping was performed once. c, Flow cytometry quantification showing GFP signal in indicated K562 CoREST–GFP cell lines transduced with the indicated sgRNAs and treated with DMSO or UM171 for 24 h. Data are mean ± s.d. of n = 3 biological replicates. d, Immunoblots showing protein levels of HDAC1 (left) or HDAC2 (right) and GAPDH in HDAC2-null and HDAC1-null K562 CoREST–GFP cells, respectively, after transduction with indicated eVLPs. Data in c and d are representative of two independent experiments. FACS-gating schemes and uncropped blots are in Supplementary Figs. 1b, 8, respectively. MW, molecular weight. Source data
Extended Data Fig. 10
Extended Data Fig. 10. Validation and genotyping of KBTBD4 base edits.
a, Flow cytometry quantification showing GFP signal in CoREST–GFP K562 cells transduced with the indicated KBTBD4 sgRNAs and treated with DMSO or UM171 for 24 h. Data are mean ± s.d. of n = 3 biological replicates and are representative of two independent experiments. b, Close-up view of the HDAC1-UM171-KBTBD4 interface showing Cα-positions of selected top-enriched sgRNAs, marked in Fig. 5b,e, as spheres. c, Base editing outcomes for selected KBTBD4 sgRNAs in K562 cells. The wild-type allele is boxed, and only alleles with ≥1% allele frequency in at least one sample are shown. Protein product sequences are shown with nonsynonymous mutations in red. Genotyping was performed once. d, Flow cytometry quantification of MOLM-13 cells expressing the indicated KBTBD4–GFP reporter. KBTBD4 stability calculated as GFP/mCherry and measurements are normalized to wild-type KBTBD4 analysed in parallel. Data are mean ± s.d. of n = 3 technical replicates and are representative of two independent experiments. FACS-gating schemes are in Supplementary Fig. 1b (a) and Supplementary Fig. 1a (d).

Update of

References

    1. Fares, I. et al. Pyrimidoindole derivatives are agonists of human hematopoietic stem cell self-renewal. Science345, 1509–1512 (2014). - PMC - PubMed
    1. Chagraoui, J. et al. UM171 preserves epigenetic marks that are reduced in ex vivo culture of human HSCs via potentiation of the CLR3-KBTBD4 complex. Cell Stem Cell28, 48–62 (2021). - PubMed
    1. Subramaniam, A. et al. Lysine-specific demethylase 1A restricts ex vivo propagation of human HSCs and is a target of UM171. Blood136, 2151–2161 (2020). - PMC - PubMed
    1. Cowan, A. D. & Ciulli, A. Driving E3 ligase substrate specificity for targeted protein degradation: lessons from nature and the laboratory. Annu. Rev. Biochem.91, 295–319 (2022). - PubMed
    1. Schreiber, S. L. The rise of molecular glues. Cell184, 3–9 (2021). - PubMed

MeSH terms

LinkOut - more resources