. 2025 Mar;639(8053):241-249.
doi: 10.1038/s41586-024-08533-3. Epub 2025 Feb 12.

Converging mechanism of UM171 and KBTBD4 neomorphic cancer mutations

Affiliations

Converging mechanism of UM171 and KBTBD4 neomorphic cancer mutations

Xiaowen Xie et al. Nature. 2025 Mar.

Abstract

Cancer mutations can create neomorphic protein-protein interactions to drive aberrant function1,2. As a substrate receptor of the CULLIN3-RING E3 ubiquitin ligase complex, KBTBD4 is recurrently mutated in medulloblastoma3, the most common embryonal brain tumour in children4. These mutations impart gain-of-function to KBTBD4 to induce aberrant degradation of the transcriptional corepressor CoREST5. However, their mechanism remains unresolved. Here we establish that KBTBD4 mutations promote CoREST degradation through engaging HDAC1/2 as the direct target of the mutant substrate receptor. Using deep mutational scanning, we chart the mutational landscape of the KBTBD4 cancer hotspot, revealing distinct preferences by which insertions and substitutions can promote gain-of-function and the critical residues involved in the hotspot interaction. Cryo-electron microscopy analysis of two distinct KBTBD4 cancer mutants bound to LSD1-HDAC1-CoREST reveals that a KBTBD4 homodimer asymmetrically engages HDAC1 with two KELCH-repeat β-propeller domains. The interface between HDAC1 and one of the KBTBD4 β-propellers is stabilized by the medulloblastoma mutations, which insert a bulky side chain into the HDAC1 active site pocket. Our structural and mutational analyses inform how this hotspot E3-neosubstrate interface can be chemically modulated. First, we unveil a converging shape-complementarity-based mechanism between gain-of-function E3 mutations and a molecular glue degrader, UM171. Second, we demonstrate that HDAC1/2 inhibitors can block the mutant KBTBD4-HDAC1 interface and proliferation of KBTBD4-mutant medulloblastoma cells. Altogether, our work reveals the structural and mechanistic basis of cancer mutation-driven neomorphic protein-protein interactions.


Conflict of interest statement

Competing interests: B.B.L. is a co-founder, shareholder and member of the scientific advisory board of Light Horse Therapeutics. N.Z. is one of the scientific cofounders and a shareholder of SEED Therapeutics. N.Z. serves as a member of the scientific advisory board of Synthex, Molecular Glue Lab and Differentiated Therapeutics with financial interests. R.M. is a scientific advisory board member and equity holder of Regenacy Pharmaceuticals. R.M. and N.C.P. are inventors on patent applications related to the CoraFluor TR-FRET probes used in this work. P.A.C. is a co-founder of Acylin Therapeutics and a consultant for Abbvie regarding p300 acetyltransferase inhibitors. The remaining authors declare no competing interests.

Figures

Fig. 1
Fig. 1. KBTBD4 MB mutants potentiate E3 activity.
a, Schematic of KBTBD4 protein domains and recurrent MB mutations. b, Normalized ex vivo proliferation over 7 days for indicated MB models after transduction with eVLPs. c, Whole-proteome quantification in KBTBD4MUT (n = 2) versus KBTBD4WT (n = 5) PDX models. Coloured dots show proteins with |log2(fold-change)| > 0.7 in KBTBD4MUT versus KBTBD4WT and P value < 0.01 (empirical Bayes-moderated t-tests). d, STRING network of proteins significantly depleted in KBTBD4MUT (n = 2) versus KBTBD4WT (n = 5) PDX models. Edge width scale depicts PPI confidence. e, HA IP immunoblots from 293T cells transfected with FLAG–CoREST and indicated HA–KBTBD4 variants treated with MLN4924 (1 µM) for 4 h. f, Immunoblots in ICB1299 after transduction with eVLPs. g, Flow cytometry quantification of GFP+ cells for KBTBD4-null CoREST–GFP cells after 1 h MLN4924 pre-treatment followed by dox-inducible overexpression of indicated KBTBD4 variant. h, Flow cytometry quantification of GFP+ cells for indicated CoREST–GFP cells with or without 24 h dox-inducible overexpression of KBTBD4-PR or KBTBD4-WT. i, Flow cytometry quantification of GFP+ cells for indicated CoREST–GFP cells with or without 24 h dox-inducible overexpression of KBTBD4-PR or KBTBD4-WT. Cells were pretreated for 2 h with DMSO or dTAG-13 (500 nM). j, TR-FRET signal between fluorescein–LHC and anti-His CoraFluor-1-labelled antibody with indicated His–KBTBD4 variant (n = 2 biological replicates). k, Immunoblots of in vitro ubiquitination assays of CRL3KBTBD4-WT and CRL3KBTBD4-PR with LHC (n = 3 biological replicates). Data in b and gi are mean ± s.d. of n = 3 biological replicates and representative of two independent experiments. P values in h and i were calculated through two-tailed unpaired t-tests for indicated comparisons. Data in e,f and j are representative of two independent experiments. FACS-gating schemes and uncropped blots are shown in Supplementary Figs. 1a and 2, respectively. Corr., corrected; DMSO, dimethylsulfoxide; HA, haemagglutinin; IP, immunoprecipitation; MW, molecular weight; NIC, non-infection control. Source data
Fig. 2
Fig. 2. DMS of the 2b-2c loop.
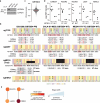
a, Schematic of the KBTBD4 2b-2c loop DMS. b, Waterfall plot displaying KBTBD4 variants ranked by log2(fold-change) enrichment in GFP over unsorted population normalized to WT. c, Swarm plot showing log2(fold-change) enrichment of KBTBD4 variants in GFP cells versus unsorted cells, normalized to WT and classified by mutation type. Dotted line indicates log2(fold-change) enrichment of WT KBTBD4 and solid black bars indicate mean for each mutation type. d, DMS for single substitutions (left) and single insertions (right) displayed as heatmaps of log2(fold-change) enrichment in GFP cells. e, DMS for double substitutions (left) and double insertions (right) displayed as heatmaps of log2(fold-change) enrichment in GFP cells. The x axis indicates the positions of the mutated amino acid pairs (X1X2), with identities of the substituted or inserted residues shown on the y axis. Specifically, the first substituted or inserted residue (X1) is indicated by the lefthand labels, whereas the second residue (X2) is indicated by each row. f, Sequence logo depicting relative entropy of amino acids at each position for single substitution, double substitution, single insertion and double insertion mutant sequences. Amino acids are coloured by their chemical characteristics: hydrophobic (black), polar (green), basic (blue), acidic (red) and neutral (purple). g, Scatterplot showing log2(fold-change) enrichment of single mutant KBTBD4 variants at the nth position (either substitution or insertion) in GFP cells (x axis) and average fold-change of the corresponding double mutants created by mutation of the adjacent n − 1 or n + 1 position (y axis). Linear correlations (dotted line) on the basis of linear least-squares regression for the substitutions are displayed on the plot (Pearson correlation coefficient r = 0.856, two-sided P = 1.74 × 10−39). Data in bg are mean of n = 3 biological replicates and the overall DMS experiment was performed once. FACS-gating schemes are shown in Supplementary Fig. 1b. Schematic in a adapted from ref. , Springer Nature America.
Fig. 3
Fig. 3. Structural mechanisms and amino acid preferences of functional KBTBD4 mutations.
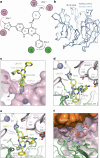
a, Cryo-EM map of LHC-bound KBTBD4 mutants with the two KBTBD4 protomers (slate and green), HDAC1 (pink), CoREST (orange) and InsP6 (red). Left, KBTBD4-PR; right, KBTBD4-TTYML. b, Ribbon diagram of the KBTBD4-PR–HDAC1–CoREST–InsP6 complex. Subunits of the complex are coloured the same way as in a. The hotspot arginine residue is shown in space filling model mode. InsP6 is shown in cyan and red sticks. c, Close-up view of the 4b-4c loops of KBTBD4-PR-A (slate) and KBTBD4-PR-B (green) after the β-propeller domain of the latter is superimposed onto that of the former. Side chains of two phenylalanine residues in the 4b-4c loop of KBTBD4-PR-A are shown in sticks. d, Close-up view of the 2b-2c loops of KBTBD4-A (slate) and KBTBD4-B (green) after the β-propeller domain of the former is superimposed onto that of the latter. Side chains of two arginine residues in the 2b-2c loop of KBTBD4-B are shown in sticks. Left, KBTBD4-PR; right, KBTBD4-TTYML. e, Alignment of KBTBD4-WT, PR and TTYML 2b-2c loop sequences. f, Single substitution DMS displayed as a heatmap of log2(fold-change) enrichment in GFP cells for each mutated amino acid in the KBTBD4-PR PRPR sequence. g, Close-up view of the interface between HDAC1 (pink) and the 2b-2c loop of KBTBD4-B (green) with the side chains of key residues shown in sticks. Left, KBTBD4-PR; right, KBTBD4-TTYML. h, Double insertion DMS displayed as a heatmap of log2(fold-change) enrichment in GFP cells for each pair of mutated amino acids (X1, X2) inserted after Ile310. Data in f and h are mean of n = 3 biological replicates and the overall DMS experiment was performed once.
Fig. 4
Fig. 4. Converging mechanism between KBTBD4 cancer mutations and UM171.
a, Simplified ligand plot of UM171–KBTBD4–HDAC1 interactions. HDAC1 and KBTBD4 residues are denoted by pink and green circles, respectively. b, Superposition analysis of the β-propellers in protomer-B of the KBTBD4-WT and KBTBD4-PR dimers. The structural differences at several top surface loops are indicated by arrows. The 2b-2c loop is labelled. c, A comparison of UM171 (yellow and blue sticks), the side chain of Tyr312 of KBTBD4-TTYML-B (cyan and red sticks) and the side chain of Arg312 of KBTBD4-PR-B (green and blue sticks) at the active site pocket of HDAC1 (pink). The three complex structures are superimposed through HDAC1. Two phenylalanine residues outlining the entrance of the HDAC1 active site tunnel are shown in sticks. d, A comparison between UM171 (yellow and blue sticks) and the 2b-2c loop of KBTBD4-PR-B with the KBTBD4–UM171–HDAC1 structure superimposed with the KBTBD4-PR–HDAC1 structure through HDAC1. The side chains of key residues at the interface are shown in sticks. e, A comparison between UM171 (yellow and blue sticks) and the 2b-2c loop of KBTBD4-TTYML-B with the KBTBD4–UM171–HDAC1 structure superimposed with the KBTBD4-TTYML–HDAC1 structure through HDAC1. The side chains of key residues at the interface are shown in sticks. f, A close-up view of the inter-molecular interfaces among KBTBD4-TTYML (green), HDAC1 (pink, surface representation), CoREST (orange, surface representation) and InsP6 (cyan, orange and red sticks). The side chains of key KBTBD4-TTYML residues involved in InsP6 interaction and at the nearby 2b-2c loop are shown in sticks. Zn, zinc.
Fig. 5
Fig. 5. HDAC1/2 inhibitors block the neomorphic activity of KBTBD4 mutants.
a, Steric clash between SAHA (yellow) and the central arginine residue at the 2b-2c loop of KBTBD4-PR-B. The KBTBD4-PR–HDAC1 complex structure is superimposed with the HDAC2–SAHA complex structure (PDB 4LXZ) through the HDAC subunits. b, Flow cytometry quantification of GFP+ cells for KBTBD4-null CoREST–GFP cells pre-treated with DMSO, CI-994 (10 µM), SAHA (10 µM) or RBC1HI (10 µM) for 1 h followed by dox-inducible overexpression of the indicated KBTBD4 variant. Data are mean ± s.d. of n = 3 biological replicates. c, Immunoblots of HA IP from 293T cells transfected with the indicated HA–KBTBD4 variant, pre-treated with MLN4924 (1 µM) for 3 h, and then treated with DMSO, UM171 (1 µM) or SAHA (10 µM) for 1 h. d, TR-FRET signal between fluorescein–LHC and anti-His CoraFluor-1-labelled antibody with indicated His–KBTBD4 mutant in the presence of DMSO, SAHA (10 µM), CI-994 (10 µM) or RBC1HI (10 µM) (n = 2 biological replicates). e, Ex vivo proliferation for ICB1572 (KBTBD4-PR), MED411FH (KBTBD4-WT) and RCMB28 (KBTBD4-WT) cells with RBC1HI treatment at indicated doses for 72 h. Data are mean ± s.d. across biological replicates from PDX cells derived from n = 5 (ICB1572), n = 3 (RCMB28) and n = 2 (MED411FH) implanted mice. f, Immunoblots showing LSD1, CoREST and GAPDH in ICB1572 after 24 h treatment with MLN4924 or RBC1HI at the indicated doses. Data in b and d and immunoblots in c and f are representative of two independent experiments. FACS-gating schemes and uncropped blots can be found in Supplementary Figs. 1a and 3, respectively. Source data
Extended Data Fig. 1
Extended Data Fig. 1. Supporting data for experiments involving PDX models.
a, Immunoblots showing KBTBD4 and GAPDH in K562 cells after transduction of the indicated eVLPs. b, Base editing efficiency and mutation outcomes for ICB1299 (left), CHLA-01-MED (center), and MED411FH-TC (right). Numbers in bars indicate percentage of A-to-G edits, and black bars indicate the lack of inserted bases in KBTBD4-WT. Base editing outcomes for protein variants ≥1% frequency shown directly below. Amino acid mutations are shown in red. Genotyping was performed once. c, Scaled gene-dependency score (Chronos) of KBTBD4 across all cell lines in the 24Q4 release of DepMap (gray dots, n = 1,150). Red bar indicates median value. d, Relative protein abundances (log2(tandem-mass tag (TMT) intensity)) in KBTBD4WT (n = 5) and KBTBD4MUT (n = 2) PDX models for selected proteins. e, STRING network of proteins enriched in KBTBD4MUT (n = 2) versus WT (n = 5) PDX models. Node color scale depicts log2(fold-change) protein abundance in mutant versus WT models. Edge width scale depicts confidence of the PPI for the nodes. Immunoblots in a are representative of two independent experiments. Uncropped blots can be found in Supplementary Fig. 4. MW, molecular weight.
Extended Data Fig. 2
Extended Data Fig. 2. Supporting data for inducible KBTBD4 overexpression experiments.
a, Immunoblots showing CoREST and GAPDH for WT and CoREST–GFP K562 cells. b, Immunoblots showing LSD1, CoREST–GFP, HDAC1, KBTBD4, and GAPDH in WT K562 CoREST–GFP knock-in cells and a clonal cell line with KBTBD4 knockout treated with DMSO or UM171 (1 µM) for 6 h. c, Immunoblots of indicated proteins in K562 KBTBD4-null CoREST–GFP cells after dox-inducible overexpression of indicated FLAG-KBTBD4 variants. d, Flow cytometry quantification of GFP+ cells for K562 CoREST–GFP cells. Data are mean ± s.d. of n = 3 biological replicates. e, Immunoblots showing LSD1, FLAG-KBTBD4, and GAPDH for K562 CoREST–GFP cells transduced with Cas9 and indicated sgRNAs and with dox-inducible overexpression of indicated KBTBD4 variants. f, Immunoblots showing HDAC1, HDAC2, FLAG-KBTBD4, and GAPDH for indicated K562 CoREST–GFP cells after dox-inducible overexpression of indicated FLAG-KBTBD4 variants (24 h). g, Immunoblots showing HDAC2-dTAG, FLAG-KBTBD4, and GAPDH for K562 CoREST–GFP HDAC1-null HDAC2-dTAG cells after dox-inducible overexpression of indicated KBTBD4 variants (24 h). HDAC1-null HDAC2-dTAG cells were pre-treated with DMSO or dTAG-13 (500 nM, 2 h). Data in a-g are representative of two independent experiments. FACS-gating schemes and uncropped blots can be found in Supplementary Figs. 1a, 5, respectively. MW, molecular weight. Source data
Extended Data Fig. 3
Extended Data Fig. 3. Supporting data for in vitro biochemical experiments and DMS.
a, TR-FRET signal between fluorescein-LHC and anti-His CoraFluor-1-labelled antibody with indicated His-KBTBD4 variant in the presence of varying concentrations of InsP6 (n = 2 biological replicates). b, Coomassie staining for in vitro ubiquitination assays of either CRL3KBTBD4-WT and CRL3KBTBD4-PR with LHC. c, Immunoblot for LSD1 of in vitro ubiquitination assays of either CRL3KBTBD4 and CRL3KBTBD4-PR with LHC. d, Scatterplot showing log2(fold-change) enrichment of KBTBD4 variants in GFP+ and in GFP cells versus unsorted cells normalized to WT. Deletion, substitution, and insertion variants are colored in blue, gray, and red, respectively, and WT is marked by a yellow diamond. MB mutant sequences are labeled. Pearson correlation coefficient r = −0.91, two-sided P value < 10−307. Data are mean of n = 3 biological replicates and the overall DMS experiment was performed once. e, TR-FRET signal between fluorescein-LHC and anti-His CoraFluor-1-labelled antibody with indicated His-KBTBD4 variant in the presence of InsP6 (50 µM) (n = 2 biological replicates). Data in a and e are representative of two independent experiments. Data in b and c are representative of n = 3 biological replicates. FACS-gating schemes and uncropped blots can be found in Supplementary Figs. 1a, 6, respectively. Corr., corrected; MW, molecular weight. Source data
Extended Data Fig. 4
Extended Data Fig. 4. Supporting data for double-substitution and -insertion mutational scanning.
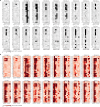
a, Double-substitution deep mutational scanning displayed as heatmaps of log2(fold-change) enrichment in GFP cells versus unsorted cells for each possible pair of mutated amino acids. b, Double-insertion deep mutational scanning displayed as heatmaps of log2(fold-change) enrichment in GFP cells versus unsorted cells for each possible pair of mutated amino acids. Color intensity represents mean of n = 3 biological replicates and the overall DMS experiment was performed once.
Extended Data Fig. 5
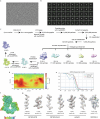
Extended Data Fig. 5. Cryo-EM data processing for the KBTBD4-PR-LHC complex.
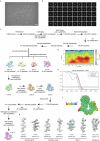
a, A representative cryo-EM micrograph out of 4,982 micrograph; scale bar, 50 nm. b, Typical 2D averages of the cryo-EM dataset. c, Flowchart of single particle analysis of the KBTBD4-PR-LHC complex. d, Angular distribution of particles used in the final reconstruction. e, Fourier shell correlation (FSC) curves for KBTBD4-PR-LHC. At the Gold-standard threshold of 0.143, the resolution is 3.42 Å. f, Local resolution map of the KBTBD4-PR-LHC complex from 2.5 to 4.5 Å. g, Density maps of representative regions of the KBTBD4-PR-LHC complex fit with the structural model shown in sticks.
Extended Data Fig. 6
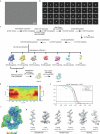
Extended Data Fig. 6. Cryo-EM data processing for the KBTBD4-TTYML-LHC complex.
a, A representative cryo-EM micrograph out of 8,325 micrographs; scale bar, 50 nm. b, Typical 2D averages of the cryo-EM dataset;. c, Flowchart of single particle analysis of the KBTBD4-TTYML-LHC complex. d, Angular distribution of particles used in the final reconstruction. e, Fourier shell correlation (FSC) curves for KBTBD4-TTYML-LHC. At the Gold-standard threshold of 0.143, the resolution is 3.30 Å. f, Local resolution map of the KBTBD4-TTYML-LHC complex from 2.5 to 4.5 Å. g, Density maps of representative regions of the KBTBD4-TTYML-LHC complex fit with the structural model shown in sticks.
Extended Data Fig. 7
Extended Data Fig. 7. Cryo-EM data processing for the KBTBD4-PR-HDAC2-CoREST complex.
a, A representative cryo-EM micrograph out of 21,866 micrographs; scale bar, 50 nm. b, Typical 2D averages of the cryo-EM dataset. c, Flowchart of single particle analysis of the KBTBD4-PR-HDAC2-CoREST complex. d, Angular distribution of particles used in the final reconstruction. e, Fourier shell correlation (FSC) curves for KBTBD4-PR-HDAC2-CoREST. At the Gold-standard threshold of 0.143, the resolution is 2.87 Å. f, Local resolution map of the KBTBD4-PR-HDAC2-CoREST complex from 2.5 to 4.5 Å. g, Density maps of representative regions of the KBTBD4-PR-HDAC2-CoREST complex fit with the structural model shown in sticks.
Extended Data Fig. 8
Extended Data Fig. 8. Cryo-EM structure of the KBTBD4-PR-HDAC2-CoREST complex.
a, Overall structure of the KBTBD4-PR-HDAC2-CoREST complex. b, Superposition of KBTBD4-PR-LHC and KBTBD4-PR-HDAC2-CoREST complexes.
Extended Data Fig. 9
Extended Data Fig. 9. Structural and functional analysis of mutant KBTBD4-LHC complexes.
a, Superposition of the two KBTBD4-PR protomers in complex with HDAC1. The two protomers, KBTBD4-PR-A (slate) and KBTBD4-PR-B (green) are superimposed via their BTB-BACK domain. b, Superposition of the KELCH-repeat domains of the two KBTBD4-PR protomers (KBTBD4-PR-A: slate; KBTBD4-PR-B: green) in complex with HDAC1. Noticeable structural differences at the 2b-2c and 4b-4c loops are indicated. c,d, Flow cytometry quantification of GFP+ cells for KBTBD4-null CoREST–GFP cells after overexpression of indicated KBTBD4 variant. e, Double-substitution deep mutational scanning displayed as heatmaps of log2(fold-change) enrichment in GFP cells versus unsorted cells for each possible pair of mutated amino acids in the KBTBD4-PR PRPR sequence. Color intensity represents mean of n = 3 biological replicates. f, Top-enriched double-insertion mutants inserted after Ile310, more effective than KBTBD4-PR, ranked by their log2(fold-change) enrichment in GFP over unsorted population. Data in c and d are mean ± s.d. of n = 3 technical replicates and representative of two independent experiments. Data in e and f are mean of n = 3 biological replicates and the overall DMS experiment was performed once. FACS-gating schemes can be found in Supplementary Fig. 1a. NIC: non-infection control. Source data
Extended Data Fig. 10
Extended Data Fig. 10. Structural and functional analysis of mutant KBTBD4-LHC and wild-type KBTBD4-LHC-UM171.
a, A comparison of the relative positions between KBTBD4 β-propeller and the HDAC1-CoREST complex in the KBTBD4-UM171-LHC and KBTBD4-PR-LHC complex structures. The two complex structures are superimposed via the KELCH-repeat domain of KBTBD4-B. All subunits in the KBTBD4-UM171-LHC complex are colored in gray. UM171 and InsP6 are not shown. b, Superposition of the overall complex structures of KBTBD4-UM171-LHC and KBTBD4-PR-LHC. All subunits in KBTBD4-UM171-LHC are colored in gray. c, Flow cytometry quantification of GFP+ cells for KBTBD4-null CoREST–GFP cells after overexpression of indicated KBTBD4 variants generated by sgM316. Data are mean ± s.d. of n = 3 technical replicates. d, Immunoblots for FLAG-KBTBD4 and GAPDH in KBTBD4-null CoREST–GFP cells overexpressing indicated KBTBD4 variants. e, TR-FRET signal between fluorescein-LHC and anti-His CoraFluor-1-labelled antibody with indicated His-KBTBD4 variant in the presence of DMSO or UM171 (10 µM) (n = 2 biological replicates). f, Flow cytometry quantification of GFP+ cells for KBTBD4-null CoREST–GFP cells with dox-inducible overexpression of indicated KBTBD4 variant and treated with either DMSO or UM171 (1 µM) for 24 h. Data are mean ± s.d. of n = 3 biological replicates. g, Immunoblots of HA IP from 293T cells transfected with indicated HA-KBTBD4 variants, pre-treated with MLN4924 (1 µM) for 3 h, and then treated with DMSO or CI-994 (10 µM) for 3 h or UM171 (1 µM) for 1 h. Data in c-g are representative of two independent experiments. FACS-gating schemes and uncropped blots can be found in Supplementary Figs. 1a, 7, respectively. Corr., corrected; MW, molecular weight; NIC: non-infection control. Source data

Update of

References

    1. Cheng, F. et al. Comprehensive characterization of protein–protein interactions perturbed by disease mutations. Nat. Genet.53, 342–353 (2021). - PMC - PubMed
    1. Mo, X. et al. Systematic discovery of mutation-directed neo-protein-protein interactions in cancer. Cell185, 1974–1985.e12 (2022). - PMC - PubMed
    1. Northcott, P. A. et al. The whole-genome landscape of medulloblastoma subtypes. Nature547, 311–317 (2017). - PMC - PubMed
    1. Lee, J. C. et al. Recurrent KBTBD4 small in-frame insertions and absence of DROSHA deletion or DICER1 mutation differentiate pineal parenchymal tumor of intermediate differentiation (PPTID) from pineoblastoma. Acta Neuropathol.137, 851–854 (2019). - PMC - PubMed
    1. Chen, Z. et al. Disease-associated KBTBD4 mutations in medulloblastoma elicit neomorphic ubiquitylation activity to promote CoREST degradation. Cell Death Differ.29, 1955–1969 (2022). - PMC - PubMed

MeSH terms

LinkOut - more resources