. 2025 Mar;639(8056):1006-1015.
doi: 10.1038/s41586-024-08540-4. Epub 2025 Feb 12.

A crucial role for the cortical amygdala in shaping social encounters

Affiliations

A crucial role for the cortical amygdala in shaping social encounters

Antonio V Aubry et al. Nature. 2025 Mar.

Abstract

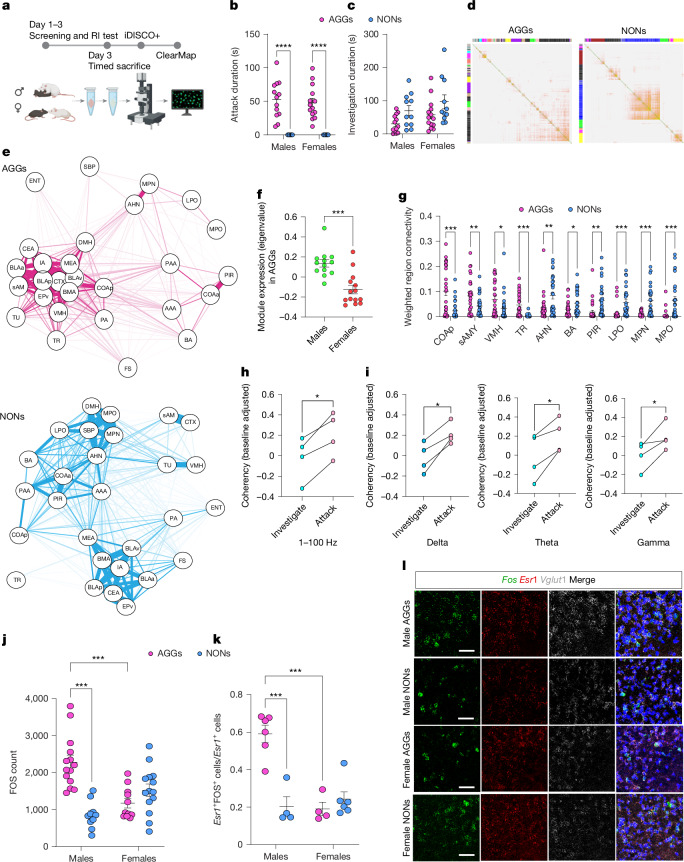
Aggression is an evolutionarily conserved behaviour that controls social hierarchies and protects valuable resources. In mice, aggressive behaviour can be broken down into an appetitive phase, which involves approach and investigation, and a consummatory phase, which involves biting, kicking and wrestling1. Here, by performing an unsupervised weighted correlation network analysis on whole-brain FOS expression in mice, we identify a cluster of brain regions, including hypothalamic and amygdalar subregions and olfactory cortical regions, that are highly co-activated in male but not in female aggressors. The posterolateral cortical amygdala (COApl)-an extended olfactory structure-was found to be a hub region, on the basis of the number and strength of correlations with other regions in the cluster. Our data also show that oestrogen receptor 1 (Esr1)-expressing cells in the COApl (COAplEsr1) exhibit increased activity during attack behaviour and during bouts of investigation that precede an attack, in male mice only. Chemogenetic or optogenetic inhibition of COAplEsr1 cells in male aggressors reduces aggression and increases pro-social investigation without affecting social reward and reinforcement behaviour. We further show that COAplEsr1 projections to the ventromedial hypothalamus and central amygdala are necessary for these behaviours. Collectively, these data suggest that, in aggressive males, COAplEsr1 cells respond specifically to social stimuli, thereby enhancing their salience and promoting attack behaviour.


Conflict of interest statement

Competing interests: The authors declare no competing interests.

Figures

Fig. 1
Fig. 1. The COApl is a key node in a differentially connected module in aggressive males.
a, Experimental timeline. b,c, Aggression duration was significantly higher in AGGs than in NONs (b; main effect of phenotype, F(1,44) = 83.30, P < 0.0001) and NONs exhibited more social investigation than did AGGs (c; main effect of phenotype, F(1,46) = 6.984, P = 0.0112) (n = 13 male AGGs, 14 female AGGs, 10 male NONs and 13 female NONs). d, Whole-brain FOS network analysis in AGGs and NONs. e, Network plot of the pink module in AGGs (top) and NONs (bottom). f, Male AGGs exhibited higher pink-module expression than did female AGGs (t(25) = 4.612, P = 0.0001). g, Regions in the pink module differed in intramodular connectivity between AGG and NON networks. All q values were less than 0.05. h, Coherency analysis in the COAp–VMH circuit during attack and investigation bouts (t3 = 5.412, P = 0.0124). i, Quantification of coherence in the delta (t3 = 3.915, P = 0.0296), theta (t3 = 3.904, P = 0.0298) and gamma (t3 = 3.241, P = 0.0478) bands. jl, FOS expression in the COAp. j,k, iDISCO+ revealed a significant phenotype × sex interaction (F(1,46) = 24.11, P < 0.0001), with male AGGs exhibiting higher FOS expression than male NONs (P < 0.0001, Tukey’s post-hoc) and female AGGs (P < 0.0001, Tukey’s post-hoc). l, Fluorescence in situ hybridization (FISH) revealed that male AGGs also exhibited a higher number of FOS+ cells expressing Esr1 (phenotype × sex interaction: F(1,16) = 23.09, P = 0.0002) than did male NONs (P < 0.0001, Tukey’s post-hoc) and female AGGs (P < 0.0001, Tukey’s post-hoc) (n = 6 male AGGs, 4 female AGGs, 4 male NONs and 6 female NONs). *P < 0.05, **P < 0.01, ***P < 0.001, ****P < 0.001. All data are mean ± s.e.m. All network data and corresponding behaviour were replicated in two cohorts. FISH and in vivo electrophysiology were carried out in a single cohort. ENTmv, entorhinal cortex medial part ventral zone; SBPV, subparaventricular zone; MPN, medial preoptic nucleus; AHN, anterior hypothalamic nucleus; LPO, lateral preoptic area; MPO, medial preoptic area; AAA, anterior aymgdala area; BA, bed nucleus of anterior commissure; FS, fundus of striatum; PA, posterior amygdala; TR, transition area; TU, tuberal nucleus; EPv, ventral endopiriform area; BMA, basomedial amygdala; CTX, cortical subplate; sAMY, striatal amygdala; BLAa, anterior basolateral amygdala; BLAp, posterior basolateral amygdala; IA, intercalated amygdala; DMH, dorsomedial hypothalamus. The illustrations in a were created with BioRender. Source Data
Fig. 2
Fig. 2. In vivo activity of COAplEsr1 cells during distinct bouts of investigation in male AGGs.
a, Experimental timeline. b, COAplEsr1 activity before and after the investigation of an odour. c, There was a main effect of cue (F(5,40) = 3.689, P = 0.0077), time (F(1,8) = 10.89, P = 0.0108) and a cue × time interaction (F(5,24) = 7.716, P = 0.0002). Post-hoc comparisons revealed an increase in COAplEsr1 activity during the investigation of soiled male (P < 0.0001) and female (P = 0.0169) bedding (n = 9 male bedding, n = 9 female bedding, n = 5 peanut, n = 5 juvenile, n = 9 fox urine, n = 9 object). NS, not significant. di, COAplEsr1 activity before and after social behaviour. d,e, There was a significant increase in activity during investigation on an attack day (trial × time interaction: F(1,5) = 44.52, P = 0.0011; d) compared with investigation bouts during a no-attack day (P = 0.0002, Tukey’s post-hoc test; e). f,g, There was a significant increase in COAplEsr1 activity during investigation bouts that preceded an attack (behaviour × time interaction: F(1,5) = 9.054, P = 0.0298; f) compared with those that occurred in isolation (P = 0.0063, Tukey’s post-hoc (n = 6); g). h,i, There was a significant difference in COAplEsr1 activity before the onset of attack when mice were engaged in investigation before the attack (behaviour × time interaction: F(1,6) = 8.662, P = 0.0258; h) compared with when they were not investigating (P = 0.0175, Tukey’s post-hoc; i). No difference was observed in COAplEsr1 activity during attack, regardless of whether it was preceded by a bout of investigation (P = 0.9989, Tukey’s post-hoc) (n = 7). *P < 0.05, **P < 0.01, ***P < 0.001. All data are mean ± s.e.m. Scale bar, 200 μm. Data from this figure were replicated in two cohorts. The illustrations in a were created with BioRender. Source Data
Fig. 3
Fig. 3. Manipulating COAplEsr1 cells alters consummatory drive in male AGGs.
a, Experimental timeline. b, Virus expression in the COApl. 3V, third ventricle. c,d, Inhibition of COAplEsr1 significantly decreased total aggression (c; virus × drug interaction: F(2,27) = 9.687, P = 0.0007, Sidak’s post-hoc P = 0.0133) and increased total investigation (d; virus × drug interaction: F(2,27) = 8.305, P = 0.0035, Sidak’s post-hoc P = 0.0035). Excitation significantly increased aggression (Sidak’s post-hoc P = 0.0142) without affecting investigation (Sidak’s post-hoc P = 0.2174) (n = 10 HM4di, n = 10 HM3dq and n = 10 mCherry). e,f, Inhibition of COAplEsr1 did not affect the latency to find hidden food (e; virus × drug interaction: F(1,16) = 1.192, P = 0.2911) or affect sex discrimination (f; virus × drug interaction: F(1,16) = 0.5122, P = 0.4845) (n = 9 HM4di and n = 9 mCherry). gi, Closed-loop optogenetic inhibition reduced total time attacking (g; virus × laser interaction: F(1,11) = 6.838, P = 0.0240, Sidak’s post-hoc P = 0.0007), decreased the percentage of interactions with an attack (h; virus × laser interaction: F(1,11) = 12.84, P = 0.0043, Sidak’s post-hoc P = 0.0006) and slightly increased total investigation time (i; virus × laser interaction: F(1,11) = 4.919, P = 0.0485, Sidak’s post-hoc P = 0.0782) (n = 7 NpHR and n = 6 YFP). jl, Social self-administration experiments. Both groups increased the number of rewarded trials with attacks (j; main effect of session: F(15,135) = 5.382, P < 0.0001). Inhibition had no effect on lever pressing (k; virus × drug interaction: F(1,18) = 0.3147, P = 0.5817) but led to a significant reduction in the percentage of rewarded trials that led to an attack (l; virus × drug interaction: F(1,18) = 13.60, P = 0.0022, Sidak’s post-hoc P < 0.0001) (n = 11 HM4di and n = 9 mCherry). *P < 0.05, **P < 0.01, ***P < 0.001, ****P < 0.001. All data are mean ± s.e.m. Scale bar, 1 mm. Data from c,d,jl were replicated in two cohorts; all other data are from a single cohort. The illustrations in a were created with BioRender. Source Data
Fig. 4
Fig. 4. Manipulating COAplEsr1 cells alters connectivity in the pink module.
a, Experimental timeline. b,c, Inhibition of of COAplEsr1 cells reduces attack duration (b; t(38) = 3.731, P = 0.0006) and increases investigation duration (c; t(38) = 4.719, P < 0.0001). d,e, The mCherry network showed higher expression of the pink module (d; t(38) = 4.442, P < 0.0001) when the two networks were combined, and preserved the connectivity and density of the pink module better than the hM4Di network did (e; t(9) = 3.983, P = 0.0032) when they were separately analysed. Each pair of points connected by a line is a single preservation metric from each network (n = 19 (HM4di) and n = 21 (mCherry)). f, Whole-brain FOS network in mice injected with mCherry or hM4Di .g, Network plot of the pink module in mice injected with mCherry (top) or with hM4Di (bottom), from the wild-type AGG network. Regions from the mCherry and hM4Di networks were plotted using the colour label from the original network. h, Of the 28 regions in the pink module, inhibition of COAplEsr1 cells significantly decreased FOS expression in 24 regions (86%). Network analyses were replicated in two cohorts. *P < 0.05, **P < 0.01, ***P < 0.001 (n = 21 mCherry and n = 19 HM4Di). All data are mean ± s.e.m. The illustrations in a were created with BioRender. Source Data
Fig. 5
Fig. 5. Optogenetic inhibition of regions downstream of COAplEsr1 cells alters social behaviour in male AGGs.
a, Schematic of experimental timeline and regions that receive monosynaptic input from COAplEsr1 neurons revealed by HSV-1 trans-synaptic anterograde tracing. Scale bar, 100 μm. b,c, Images of FOS+ cells in the ventrolateral portion of the VMH (VMHvl) (b) and CEA (c) from mice injected with hM4Di or mCherry. d, Schematic of behavioural set-up. e, Inhibition of terminals in the VMH with NpHR reduces attack duration in mice injected (virus × laser interaction: F(1,14) = 7.893, P = 0.0139, Sidak’s post-hoc P = 0.0048) and increases investigation duration (virus × laser interaction: F(1,14) = 4.939, P = 0.0436, Sidak’s post-hoc P = 0.0402). f, Inhibition of terminals in the CEA reduces attack duration in mice injected with NpHR (virus × laser interaction: F(1,17) = 3.654, P = 0.0729, Sidak’s post-hoc P = 0.0239) but has no effect on investigation duration (virus × laser interaction: F(1,17) = 0.3555, P = 0.5589, Sidak’s post-hoc P = 0.3696) (n = 9 (VMH NpHR), n =  7 (VMH YFP), n = 11 (CEA NpHR) and n = 8 (CEA YFP)). Scale bar, 200 μm. *P < 0.05, **P < 0.01; NS, not significant. All data are mean ± s.e.m. The illustrations in a,d,e,f were created with BioRender. PVH, paraventricular nucleus of the hypothalamus; NAc, nucleus accumbens; AON, anterior olfactory nucleus; ARH, arcuate nucleus of hypothalamus; OT, olfactory tubercle; EP, endopiriform nucleus. Source Data
Extended Data Fig. 1
Extended Data Fig. 1. Ethological analyses of social behaviour in AGGs and NONs.
ac, Females engage in more facial investigation than males (main effect of sex: F(1,46) = 9.725, p = 0.0031; female AGG vs male AGG: p = 0.0008, female NON vs male AGG: p = 0.0145; Tukey’s post-hoc, a), while males engaged in more flank investigation (main effect of sex: F(1,46) = 5.480, p = 0.0236, b). There were no differences in anogenital investigation (sex x phenotype interaction: F(1,46) = .6624, p = 0.4199, c). df, Females delivered slightly more bites (t(25) = 1.808, p = 0.0827, d) and males engaged in more wrestling behaviour (t(25) = 2.601, p = 0.0154, e) with no differences in the number of kicks delivered (t(25) = 0.09111, p = 0.9281, f). n = 13 male AGG, 14 female AGG, 10 male NON, 13 female NON. All data are mean ± s.e.m. Source Data
Extended Data Fig. 2
Extended Data Fig. 2. Regional differences in FOS expression between female and male AGGs, and preservation analysis.
ac, Summed z-scores for density and connectivity measures in all modules. Each coloured circle corresponds to a module (a), z-statistics for connectivity (b) and density measures for each module (c). See Table 2 for detailed descriptions of z-statistics. d, Heat map of whole-brain FOS differences between male AGG vs. NON and female AGG vs. NON. e,f, Top 20 regions with the largest FOS expression differences in males (e) and females (f). n = 13 male AGG, 14 female AGG, 10 male NON, 13 female NON. All data are mean ± s.e.m. Source Data
Extended Data Fig. 3
Extended Data Fig. 3. Module preservation analyses.
a, The blue module in the NON network (left) was not preserved in the AGG network (right). b, Heat map of FOS expression between male AGG vs. NON and female AGG vs. NON in the pink module. c, The pink module of AGGs (right) was not preserved in AGGs who investigated a novel object. d, The pink module of NONs (right) was not preserved in NONs who investigated a novel object. n = 10 AGG object, n = 10 NON object, n = 27 AGG social, n = 23 NON social. All data are mean ± s.e.m. Source Data
Extended Data Fig. 4
Extended Data Fig. 4. Sample traces from multi-region LFPs in the COAp and VMH during attack and investigation.
a–d, Representative traces of raw (1–100 Hz) and filtered (delta: 1–4 Hz, theta: 5–12 Hz, and gamma: 40–100 Hz) LFP signal in COApl (a,c), VMH (b,d) during attack and investigation. eg, Coherence in the delta band (investigation: t4 = 1.121, p = 0.3439; attack: t4 = 4.080, p = 0.0266, e), theta band (investigation: t4 = 0.2230, p = 0.8378; attack: t4 = 3.118, p = 0.0526, f) and gamma band (investigation: t4 = .03658, p = 0.9738; attack: t4 = 3.65, p = 0.0355, g). Source Data
Extended Data Fig. 5
Extended Data Fig. 5. Cellular phenotyping of FOS+ cells in the COApl.
a, FOS-positive cells in the COAp of males. (Phenotype: F(1,22) = 33.86, p < 0.0001, Region: F(1,22) = 7.731, p = 0.0109.) Post-hoc tests revealed that male AGGs had an increase of FOS-positive cells in the lateral portion of the COAp compared to the medial portion (p = 0.014). b,c, There were no group differences in the total amount of Esr1+ cells (sex × phenotype interaction: F(1,16) = 0.6906, p = 0.4182, b), or the number of Esr1 cells which express Vglut1 (sex × phenotype interaction: F(1,16) = 0.05229, p = 0.8220, c). df, There were no group differences in the percentage of FOS+ cells which express Vglut1 (sex × phenotype interaction: F(1,16) = 1.658, p = 0.2162, d), Esr1 (sex × phenotype interaction: F(1,16) = 0.9610, p = 0.3415, e), or FOS-positive cells which did not express ESR1 (sex × phenotype interaction F(1,16) = 0.9610, p = 0.3415, f). n = 6 Male AGG, 4 Female AGG, 4 Male NON, 6 Female NON. All data are mean ± s.e.m. Source Data
Extended Data Fig. 6
Extended Data Fig. 6. Cellular phenotyping in response to odours in males and in vivo activity of COAplEsr1 cells during female social behaviour.
a, Post–pre differences in responses to odours (F(1.587,10.14) = 7.836, p = 0.0114). Male bedding vs. female bedding (p = 0.0392), peanut odour (p = 0.0392), fox urine (p = 0.0392), or a novel object (p = 0.0392) n = 9 male bedding, n = 9 female bedding, n = 5 peanut, n = 5 juvenile, n = 9 fox urine, n = 9 object, Holm-Sidak post hoc. b, FOS expressing cells (F(3,15) = 4.112, p = 0.0258). Naive vs. bedding (p = 0.0152), fox urine (p = 0.0269) and peanut odour (p = 0.0558). c, Percentage of FOS cells expressing ESR1(F(3,15)= 39.02, p < 0.0001). Bedding vs. naive (p = 0.0004), peanut (p < 0.0001) and fox urine (p < 0.0001). Naive vs. fox urine (p = 0.0212) and peanut (p = 0.0136). d, Percentage of ESR1 cells expressing FOS (F(3,15) = 39.47, p < 0.0001), comparing responses between bedding vs. naive (p = 0.0004), peanut (p < 0.0001) and fox urine (p < 0.0001). e, FOS in ESR1 cells (F(3,15)= 39.02, p < 0.0001). fh, COAplEsr1 activity during the investigation of soiled female bedding (t(5) = 5.315, p = 0.0032, f), fox urine (t(5) = 1.180, p = 0.2912, g), or ethanol (t(4) = 0.801, p = 0.4643, h). n = 6 bedding, n = 6 fox urine, n = 5 ethanol. i, COAplEsr1 activity during attack and investigation trials (interaction: F(1,4) = 6.407, p = 0.0646, Sidak’s post-hoc: p = 0.0270, n = 5). j, COAplEsr1 activity during investigation bouts (interaction: F(1,10) = 1.252, p = 0.3140, Sidak’s post-hoc: p = 0.6020, isolated) (Sidaks’s post-hoc: p = 0.9909, before attack, n = 6). k, COAplEsr1 activity during attack bouts (interaction: F(1,5) = 0.5374, p = 0.4964, Sidaks’s post-hoc: p = 0.8735, isolated, Sidak’s post-hoc: p = 0.9881, after investigation n = 6, j). ln, COAplEsr1 activity across estrous cycle. COAplEsr1 activity during investigation trials (F (1, 6) = 9.428, p = 0.0219; all cylces: t(9) = 2.917, p = 0.0171, n = 10, l), investigation during attack trials (F (1, 6) = 1.877, p = 0.2198, all cycles: t(9) = 1.250, p = 0.2428, n = 10, m), and during aggression (F (1, 7) = 0.3587, p = 0.5681,; all cylces: t(10) = 0.5035, p = 0.6255, n = 11, n). All data are mean ± s.e.m. Source Data
Extended Data Fig. 7
Extended Data Fig. 7. Ethological analyses of social behaviour during RI with a male or female intruder.
ac, Number of bites (interaction: F(2,27) = 7.036, p = 0.0035, a), kicks (interaction: F(2,27) = 3.254, p = 0.0542, b), and wrestling (interaction: F(2,27) = 3.828, p = 0.0344, c), following chemogenetic inhibition (bites: Sidak’s post-hoc: p = 0.0363, kicks: Sidak’s post-hoc: p = 0.0457, wrestling: Sidak’s post-hoc: p = 0.1729) and excitation (bites: Sidak’s post-hoc: p = 0.0470, kicks: Sidak’s post-hoc: p = 0.9874, wrestling: Sidak’s post-hoc: p = 0.3511). df, Anogenital investigation (interaction: F(2,27) = 5.634, p = 0.0090, d), withdrawals (interaction: F(2,27) = 4.218, p = 0.0255, e), and facial investigation (interaction: F(2,27) = 3.514, p = 0.0440, f) following chemogenetic inhibition (anogenital investigation: Sidak’s post-hoc: p = 0.0111, withdrawals: Sidak’s post-hoc: p = 0.0163, facial investigation: Sidak’s post-hoc: p = 0.9903) and excitation (anogenital investigation: Sidak’s post-hoc: p = 0.4065, withdrawals: Sidak’s post-hoc: p = 0.7535, facial investigation Sidak’s post-hoc: p = 0.1537), n = 10 hM4Di, 10 hM3Dq 10 mCherry. g,h, Acquisition of self-administration (interaction: F(15, 135) = 0.7175, p = 0.7635, g) and progressive ratio breakpoint (interaction: F(1, 9) = 0.1712, p = 0.6887, h) n = 7 hM4Di, 4 mCherry. i,j, Investigation of fox urine (interaction: F(1, 13) = 0.6169, p = 0.4463, n = 9 hM4Di, 6 mCherry, i) and time in centre time of an open field (t14 = 1.007, p = 0.3308, n = 10 hM4Di, 6 mCherry, j) following chemgenetic inhibition. k, Representative image of COApm infection. l,m, Attack (t5 = 0.9657, p = 0.3785, l) and investigation (t5 = 1.127, p = 0.3108, m) following inhibition of COApm, n = 6 hM4Di & mCherry. np, Mounting duration (t(5) = 0.7079, p = 0.5106, n), number of mounts (t(5) = 1.387, p = 0.2242, o), and investigation (t(5) = 1.004, p = 0.3616, p) following inhibition of COApl. n = 6 NpHR. All data are mean ± s.e.m. Scale bar: 200 μm. Source Data
Extended Data Fig. 8
Extended Data Fig. 8. Manipulation of COAplEsr1 cells has no effect on female social behaviour.
ac, There were no effects of inhibiting or exciting COAplEsr1 cells on total attack duration (virus × drug interaction: F(2,18) = 0.2719, p = 0.7650, a), bites (F(2,18) = 0.3465, p = 0.7118, b) or kicks (F(2,18) = 0.9476, p = 0.4062, c) delivered to the intruder. df, Manipulation of COAplEsr1 cells did not affect anogenital (virus × drug interaction: F(2,18) = 0.7764, p = 0.4749, d), facial (F(2,18) = 1.313, p = 0.2937, e), or flank (F(2,18) = 0.7432, p = 0.4896, f) investigation n = 7 hM4Di, 7hM3Dq & 7 mCherry. All data are mean ± s.e.m. Source Data
Extended Data Fig. 9
Extended Data Fig. 9. Ethological analyses of social behaviour and preservation statistics from the DREADD iDISCO+ experiment.
a–c, Inhibiting COAplEsr1 cells results in a reduction in bites (t25 = 3.883, p = 0.0007, a) and kicks (t25 = 2.11, p = 0.0450, b) delivered to the intruder with no effect on wrestling (t25 = 1.708, p = 0.0863, c) compared to the mCherry group. df, Mice injected with the hM4Di virus also displayed an increase in anogenital (t25 = 4.441, p = 0.0002, d), facial (t25 = 2.718, p = 0.0118, e) and flank (t25 = 3.496, p = 0.0018, f) investigation n = 13 hM4Di, 14 mCherry. g, In addition to the pink module, inhibiting the COApl alters the preservation of the red module (t9 = 3.600, q = 0.022980). h, The pink module had the highest percentage of regions (85%) which showed a decrease in FOS. All data are mean ± s.e.m. Source Data
Extended Data Fig. 10
Extended Data Fig. 10. Verification of monosynaptic connectivity between the COApl and the VMH and CEA.
a, HSV-1 trans-synaptic anterograde tracing after 48 h. There were no downstream labelled cells in the VMH or CEA. Scale bar, 100 μm. b, Anterograde tracing with AAV-hSyn-FLEx-mGFP-2A-Synaptophysin-mRuby confirmed monosynaptic connectivity between ESR1+ cells in the COApl and the VMH and CEA. Scale bar: 200 μm. c, Quantification of mRuby+ puncta (left) and ChR2-assisted circuit mapping of COAplEsr1→VMH pathway showing monosynaptic (with TTX) glutamatergic (NBQX) excitatory (Cs-based internal, clamped at −70 mV) connections in 4/7 VMH cells. d, Quantification of mRuby+ puncta (left) and ChR2-assisted circuit mapping of COAplEsr1→ CEA pathway showing monosynaptic (with TTX) glutamatergic (NBQX) excitatory connections (Cs-based internal, clamped at −70 mV) in 3/4 CEA neurons. n = 3 mice for ChR2-assisted circuit mapping and N = 4 for anterograde tracing. The illustrations were created with BioRender. All data are mean ± s.e.m. Source Data
Extended Data Fig. 11
Extended Data Fig. 11. Schematic of brain regions involved in aggression and aggression reward.
Activity of the COApl and its outputs to the VMH and CEA enhance aggressive social behaviour. By contrast, the activity of the basal forebrain (BF) and ventral premammilary nucleus (PMv) enhance the rewarding properties of aggression, whereas the lateral habenula (LHb) and dorsal raphenucleus (DRN) decrease the rewarding properties of aggression. The illustration was created with BioRender.

Update of

References

    1. Craig, W. Appetites and aversions as constituents of instincts. Biol. Bull.34, 91–107 (1918). - PMC - PubMed
    1. Hashikawa, K., Hashikawa, Y., Falkner, A. & Lin, D. Y. The neural circuits of mating and fighting in male mice. Curr. Opin. Neurobiol.38, 27–37 (2016). - PMC - PubMed
    1. Aubry, A. V. et al. Sex differences in appetitive and reactive aggression. Neuropsychopharmacology47, 1746–1754 (2022). - PMC - PubMed
    1. Golden, S. A. et al. Basal forebrain projections to the lateral habenula modulate aggression reward. Nature534, 688–692 (2016). - PMC - PubMed
    1. Flanigan, M. E. et al. Orexin signaling in GABAergic lateral habenula neurons modulates aggressive behavior in male mice. Nat. Neurosci.23, 638–650 (2020). - PMC - PubMed

Substances

LinkOut - more resources