. 2025 Feb;57(2):450-465.
doi: 10.1038/s12276-025-01408-1. Epub 2025 Feb 12.

A1AT dysregulation of metabolically stressed hepatocytes by Kupffer cells drives MASH and fibrosis

Affiliations

A1AT dysregulation of metabolically stressed hepatocytes by Kupffer cells drives MASH and fibrosis

Jeong-Su Park et al. Exp Mol Med. 2025 Feb.

Abstract

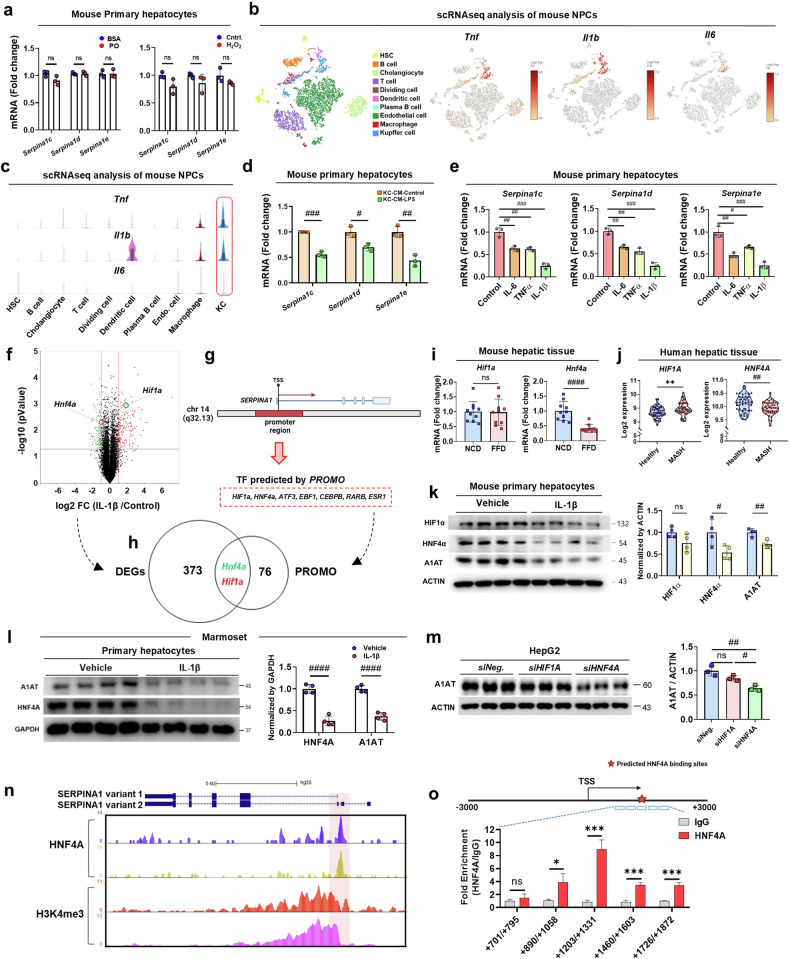
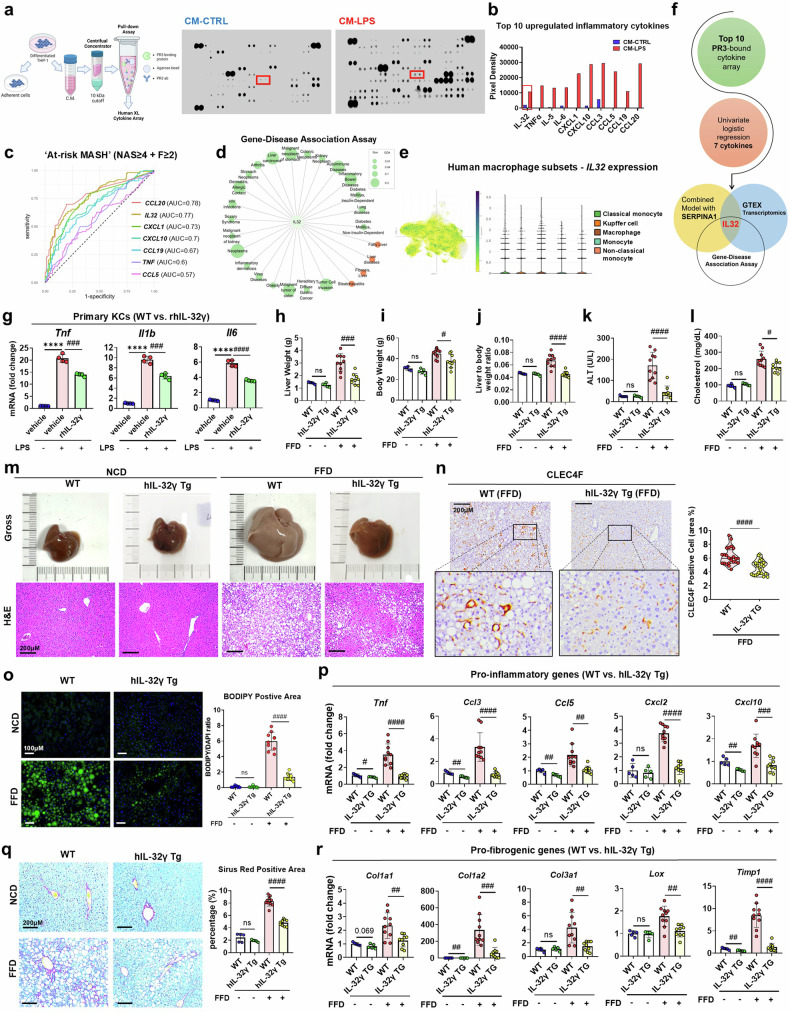
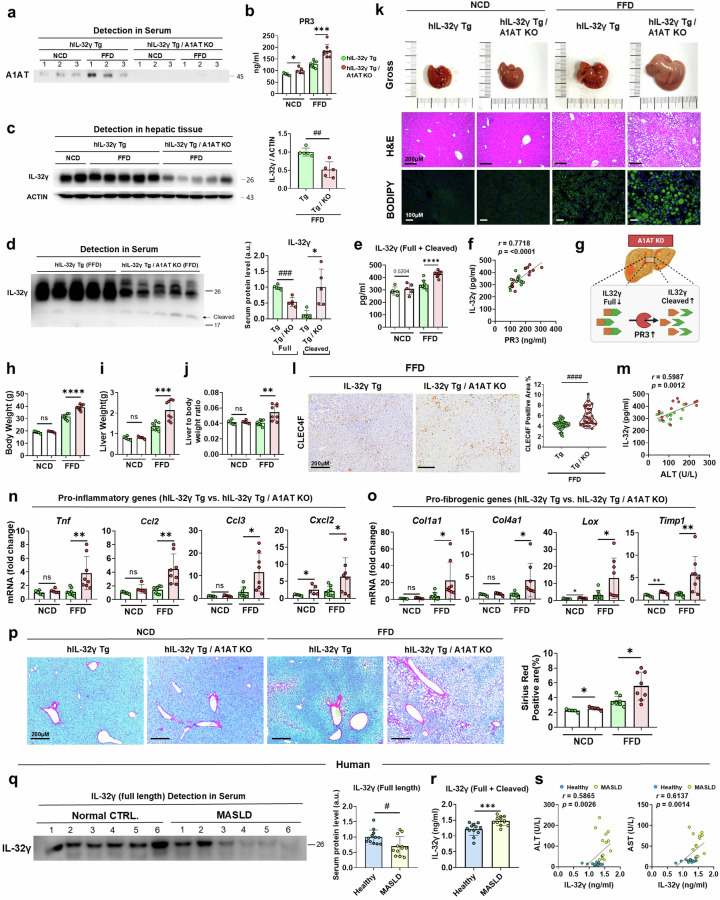
Metabolic dysfunction-associated steatohepatitis (MASH) is associated with the activation of Kupffer cells (KCs) and hepatic stellate cells, at which point a metabolically stressed hepatocyte becomes integral to the progression of the disease. We observed a significant reduction in the level of alpha-1-antitrypsin (A1AT), a hepatocyte-derived secreted factor, in both patients with MASH and mice fed a fast-food diet (FFD). KC-mediated hepatic inflammation, most notably IL-1β, led to the transcriptional inhibition of A1AT by HNF4α. In quintuple Serpina1a-e knockout mice, ablation of A1AT worsened MASH through increased activity of proteinase 3 (PR3), a proinflammatory protease produced by F4/80hi/CD11blow/TIM4-/CCR2+ monocyte-derived KCs (MoKCs). Conversely, A1AT restoration or PR3 inhibition mitigated MASH progression. A PR3-bound cytokine array identified IL-32 as a key factor associated with MASH. Combining IL-32 with SERPINA1, the gene encoding A1AT, synergistically predicted patients at risk of MASH through univariate logistic regression analysis. Furthermore, in vivo overexpression of IL-32γ alleviated MASH induced by FFD. However, additional knockout of A1AT increased PR3 activity, consequently abolishing the anti-MASH effects of IL-32γ. Blocking PR3-mediated IL-32γ cleavage via the V104A mutation sustained its protective actions, while the PR3-cleaved C-terminal fragment activated KCs. Additionally, after cleavage, the antifibrogenic effect of IL-32γ is lost, resulting in a failure to prevent the activation of hepatic stellate cells. This study highlights the critical role of hepatocyte-derived A1AT in the PR3/IL-32γ axis during MASH development. Strategies to correct A1AT dysregulation, such as A1AT supplementation or PR3 inhibition with sivelestat, may offer protection against the development and progression of MASH and fibrosis. Elevated hepatic IL-1β levels in MASH lead to the downregulation of A1AT via the transcription factor HNF4α, resulting in increased recruitment of proinflammatory MoKCs and heightened PR3 activity. PR3 cleaves IL-32γ, transforming it from an anti-inflammatory and antifibrogenic cytokine into a potent activator of KCs and failing to prevent HSC activation. This cascade amplifies liver inflammation and fibrosis, suggesting that targeting the A1AT/PR3/IL-32γ axis could be a strategy for treating MASH.


Conflict of interest statement

Competing interests: The authors declare no competing interests.

Figures

None
Elevated hepatic IL-1β levels in MASH lead to the downregulation of A1AT via the transcription factor HNF4α, resulting in increased recruitment of proinflammatory MoKCs and heightened PR3 activity. PR3 cleaves IL-32γ, transforming it from an anti-inflammatory and antifibrogenic cytokine into a potent activator of KCs and failing to prevent HSC activation. This cascade amplifies liver inflammation and fibrosis, suggesting that targeting the A1AT/PR3/IL-32γ axis could be a strategy for treating MASH.
Fig. 1
Fig. 1. Downregulation of A1AT under MASLD/MASH conditions exacerbates hepatic inflammation and fibrosis.
ad, Two replicative secretome proteomics analyses of CM from NCD- and FFD-fed (24-week-old) mice indicating total clustered proteins (a), secreted proteins (b), significantly different proteins (c) and differentially secreted proteins (d). e, Enrichment analysis of downregulated proteins revealed in the secretome proteomics study. f, The list of proteins from the secretome proteomics analysis showing the relative fold change compared with NCD–HCM. g, Relative hepatic tissue expression of Serpina1c-e mRNA in the NCD- and FFD-fed mice. h, Serum levels of A1AT detected in the NCD- and FFD-fed mice via ELISA. i, Correlations of A1AT, PR3 and the PR3/A1AT ratio with the serum ALT level in the NCD- and FFD-fed mice. j, Protein expression of A1AT in the hepatic tissue of preclinical models, such as the FFD (24 week feeding), HFD (24 week feeding), MCD (4 week feeding) and MCD–HFD (6 week feeding)-induced MASLD models. k, Human gene expression of A1AT in accordance with different disease states, fat composition, BMI, inflammation score and NAS. l, Detection of the serum levels of A1AT and PR3 and the PR3/A1AT ratio in the control group (healthy) and patients with MASLD via ELISA. m, Detection of A1AT protein expression in control groups (healthy) and patients with MASH via IHC staining. n, Correlations of A1AT, PR3 and the PR3/A1AT ratio with the serum ALT and AST levels in the control group (healthy) and patients with MASLD. The data are presented as the means ± s.d., n ≥ 5; *,#P < 0.05, **,##P < 0.01, ***,###P < 0.001 and ****,####P < 0.0001 versus the control model. ns, not significant.
Fig. 2
Fig. 2. Quintuple deletion of Serpina1a–e exacerbates MASH progression with increased hepatic inflammation and fibrosis.
a, Serum A1AT protein levels in A1AT KO and WT mice. b, Serum PR3 levels in NCD-fed WT (n = 5), NCD-fed A1AT KO (n = 5), FFD-fed WT (n = 10) and FFD-fed A1AT KO (n = 10) mice. c, Hepatic tissue mRNA expression of Prtn3 in each group. di, BW (d), LW (e), LBW ratio (f) and serum levels of ALT (g), AST (h) and cholesterol (i) in each group. j, Representative images of freshly collected liver tissues and H&E-stained liver sections from each group. k, Representative immunohistochemical staining of CLEC4F-positive KCs in liver tissue sections from each group. Quantification of the CLEC4F-positive area relative to that of WT control mice in both the NCD and FFD groups. l, Relative mRNA expression of proinflammatory genes in hepatic tissues from each group. m, Relative mRNA expression of profibrogenic genes in hepatic tissues from each group. n, Representative images of Sirius red-stained liver tissue sections from each group. The data are presented as the means ± s.d., n ≥ 5; *,#P < 0.05, **,##P < 0.01; ***,###P < 0.001 and ****,####P < 0.0001 versus the control model. ns, not significant.
Fig. 3
Fig. 3. A1AT supplementation or PR3 inhibition improves steatohepatitis and fibrosis in mice.
af, BW (a), LW (b), LBW ratio (c), appearance of freshly collected liver tissue samples: treated with Respreeza (d) and sivelestat (e), and serum levels of alanine transferase (f) in the vehicle (NCD), vehicle (FFD), Respreeza (FFD) and sivelestat (FFD) groups. NCD-fed vehicle, n = 5; FFD-fed vehicle, n = 8 and FFD-fed and Respreeza-treated groups, n = 8. FFD-fed vehicle-fed, n = 10 and FFD-fed and sivelestat-treated groups, n = 10. g, Serum PR3 levels in each group using immunoblot. h,i, H&E- and BODIPY-stained liver sections. Each representative image of a BODIPY-stained section was selected and measured to determine the BODIPY-positive area (green, for lipid accumulation) and the 4,6-diamidino-2-phenylindole (DAPI)-positive area (blue, for nuclei and normalization). j, Relative mRNA expression of proinflammatory genes in hepatic tissues from the vehicle (NCD), vehicle (FFD) and Respreeza (FFD) groups. k, Relative mRNA expression of proinflammatory genes in hepatic tissues from the vehicle (FFD) and sivelestat (FFD) groups. l,m, Sirius red-stained liver sections from each group. Each representative image of a whole-body liver section from each group was analyzed to determine the Sirius red-positive area. n,o, Relative expression of profibrogenic genes in hepatic tissue from each group. p, IHC staining image of CLEC4F-positive KCs in each group. The data are presented as the means ± s.d; *,#P < 0.05, **,##P < 0.01, ***,###P < 0.001 and ****,####P < 0.0001 versus the control model. ns, not significant.
Fig. 4
Fig. 4. Elevated IL-1β leads to HNF4α-mediated suppression of A1AT expression in hepatocytes.
a, Relative mRNA expression of Serpina1c-e in hepatocytes treated with palmitic acid, oleic acid (PO) and hydrogen peroxide (H2O2). b, scRNA-seq analysis of NPCs from the NCD- and FFD-fed mice. Visualization of the scRNA-seq data highlighting the gene expression patterns of the cytokines Tnf, Il1b and Il6. c, A violin plot visualization of the scRNA-seq data, highlighting the gene expression patterns of the cytokines Tnf, Il1b and Il6 in different cell types. d, Relative expression of Serpina1c-e mRNA in hepatocytes treated with CM from LPS-simulated (CM-KC-LPS) or untreated KCs (CM-KC-Control). e, Relative expression of Serpina1c-e mRNA in primary hepatocytes treated with recombinant TNF, IL-6 and IL-1β proteins. All recombinant proteins were treated at 100 ng/ml, for 24 h. f, A volcano plot of differential mRNA expression between the IL-1β recombinant protein-treated group and the untreated group (control). The selected genes with P values (P < 0.05) and fold changes (>1.5) are labeled with green/red dots reflecting down-/upregulated genes. g, Prediction of SERPINA1 gene promoter-binding transcription factors via PROMO software (version 3.0.2) with 3,000 bp upstream to 3000 bp downstream of the SERPINA1 transcription initiation site (TSS) located in the promoter region. h, A Venn diagram indicating the integration of the differentially expressed genes (DEGs) (f) and prediction of transcription factors (g). i, Relative mRNA expression of Serpina1 gene transcription factor candidates (Hif1a and Hnf4a) in hepatic tissue samples from NCD- and FFD-fed mice. j, mRNA expression levels of HIF1A and HNF4A in human hepatic tissues were analyzed via publicly available human liver RNA-seq datasets in the GEO database (GSE48452 and GSE61260). k, Protein levels of HIF1α, HNF4α and A1AT in hepatocytes treated with recombinant IL-1β protein or untreated hepatocytes (control). l, Primary hepatocytes isolated from marmosets were stimulated with IL-1β for 48 h. Protein expression of A1AT and HNF4α was detected. m, Relative protein expression of A1AT in HepG2 cells transfected with siHIF1a, siHNF4a or the siNegative control (siNeg.). n, Browser track showing HNF4A (from GSM469863 and GSM469864) and H3K4me4 (GSM2534178 and GSM2534179) ChIP-seq data in the SERPINA1 region. Pink highlights depict the SERPINA1 variant 1 promoter. o, The binding affinity of HNF4α for the SERPINA1 promoter in HepG2 cells was investigated via a ChIP assay. This involved the use of an HNF4α antibody and an IgG control. Additionally, RT‒PCR experiments were conducted with various primer combinations to further examine this interaction. The data are presented as the means ± s.d.; *,#P < 0.05, **,##P < 0.01, ***,###P < 0.001 and ****,####P < 0.0001 versus the control model. ns, not significant.
Fig. 5
Fig. 5. MoKCs play a crucial role in increasing PR3 levels, leading to hepatic inflammation in MASH.
a,b, Representative images of immunohistochemical staining for PR3 expression in liver tissue sections from NCD- and FFD-fed mice (a) and healthy controls versus patients with MASH (b). c, Relative mRNA expression of Prnt3 in primary NPCs isolated from NCD- and FFD-fed mice. d, scRNA-seq analysis of NPCs from NCD- and FFD-fed mice, showing the distribution of Prtn3 expression across different cell types. e, Representative co-immunofluorescence images of liver sections from both NCD- and FFD-fed mice stained for CLEC4F (red, indicating Kcs), PR3 (green) and DAPI (blue, indicating nuclei). f, scRNA-seq analysis of EmKCs (Tim4+ and Ccr2) and MoKCs (Tim4 and Ccr2+) in the Kc pool from NCD- and FFD-fed mice. g, Flow cytometry gating strategy for identifying MoKCs (CD45+, F4/80+, CD11blow, TIM4 and CCR2+) and EmKCs (CD45+, F4/80+, CD11blow, TIM4+ and CCR2) in liver tissue. h, Quantification of EmKC and MoKC percentages in WT, A1AT KO and A1AT KO mice treated with sivelestat. i, Relative mRNA expression of proinflammatory genes (Tnf, Il1b and Il6) in MoKCs sorted from WT, A1AT KO and A1AT KO mice treated with sivelestat. j, Relative mRNA expression of proinflammatory genes (Tnf, Il1b and Il6) in MoKCs stimulated with CM (CM-control, CM-LPS or CM-LPS + sivelestat). k, Relative mRNA expression levels of proinflammatory genes in ImKCs treated with PR3, LPS and Sivelestat. The data are presented as the means ± s.d.; *,#P < 0.05, **,##P < 0.01, ***,###P < 0.001 and ****,####P < 0.0001 versus the control model. ns, not significant.
Fig. 6
Fig. 6. The PR3-targeting protein IL-32γ protects against liver inflammation and fibrosis in mice treated with MASH.
a, Proteome profiling of a human cytokine array for co-immunoprecipitation of endogenously secreted PR3 in CM from LPS-stimulated (CM-LPS) and nonstimulated (CM-CTRL) THP-1 cells. b, A bar graph indicating the average signal intensities of framed spots on the array blots from a. Each red bracket in the cytokine array analysis indicates the location of interleukin (IL)-32. c, Univariate logistic regression analysis was conducted in a discovery cohort (n = 130) to identify patients ‘at-risk’ from MASH based on the gene expression of PR3-bound cytokines. d, The gene‒disease network for IL32 was examined via data from genome-wide association studies that focused on records with a significance level of P < 1 × 10−6. e, Human macrophage subset gene expression of IL32 based on the Single Cell Portal, Broad Institute. f, A Venn diagram illustrating the ability of PR3 to target the inflammatory cytokine IL-32 and its relationship with SERPINA1 and MASH pathogenesis. g, Relative mRNA expression of proinflammatory genes in primary KCs co-stimulated with LPS and recombinant human IL-32γ (rhIL-32γ; 100 ng/ml) for 6 h. hj, BWs (h), LWs (i) and LBW ratios (j) of NCD-fed WT mice (n = 5), NCD-fed hIL-32γ Tg mice (n = 5), FFD-fed WT mice (n = 10) and FFD-fed Tg mice (n = 9). k,l, Detection of the serum ALT (k) and cholesterol (l) levels in each group. m, The appearance of freshly collected liver tissues and H&E staining of liver sections from each group. n, IHC staining image of CLEC4F-positive KCs in FFD-fed Tg mice and FFD-fed WT mice. o, BODIPY-stained liver sections from each group. Representative images of BODIPY-stained sections were selected, and BODIPY-positive areas (green, for lipid accumulation) and DAPI-positive areas (blue, for nuclei and normalization) were measured. p, Relative mRNA expression of proinflammatory genes in the hepatic tissues of each group. q, Representative images of Sirius red-stained liver sections from each group. Representative images of whole-body liver sections were analyzed for Sirius red-positive areas. r, Relative mRNA expression of profibrogenic genes in liver sections. The data are presented as the means ± s.d.; *,#P < 0.05, **,##P < 0.01, ***,###P < 0.001 and ****,####P < 0.0001 versus the control model. ns, not significant.
Fig. 7
Fig. 7. Loss of A1AT blunts the IL-32γ-mediated protective action via proteolytic degradation and cleavage.
a, Immunoblot analysis of serum A1AT obtained from the NCD- and FFD-fed hIL-32γ Tg mice and the NCD- and FFD-fed Tg/A1AT KO mice. b, Serum PR3 concentration of each group measured via ELISA. NCD-fed Tg mice, n = 5; NCD-fed Tg/KO mice, n = 5; FFD-fed Tg mice, n = 8 and FFD-fed Tg/KO mice, n = 8 were used. c, Hepatic expression of the IL-32γ protein in the NCD- and FFD-fed hIL-32γ Tg mice and the NCD- and FFD-fed hIL-32γ Tg/A1AT KO mice. d, Immunoblot analysis of serum IL-32γ in the NCD- and FFD-fed hIL-32γ Tg mice and FFD-fed hIL-32γ Tg/A1AT KO mice. e, Serum IL-32γ concentrations in each group were measured via ELISA. f, Correlation between the serum level of PR3 and that of IL-32γ in hIL-32γ Tg and hIL-32γ Tg/A1AT KO mice. g, Graphical abstract showing PR3-mediated IL-32γ degradation and cleavage in A1AT-depleted conditions. hj, BWs (h), LWs (i) and LBW ratios (j) in each group. k, Images of freshly collected livers and liver sections from each representative group stained with H&E and BODIPY. l, IHC staining image of CLEC4F-positive KCs in FFD-fed Tg mice and FFD-fed Tg/KO mice. m, Correlation between the serum levels of IL-32γ and ALT in Tg and Tg/KO mice. n,o, Relative mRNA expression of proinflammatory genes (n) and profibrogenic genes (o) in hepatic tissue samples from each group. p, Representative images of Sirius red-stained liver sections from each group. Each representative image of a whole-body liver section was analyzed for the Sirius red-positive area. q, Detection of cleaved IL-32γ in serum samples from the control group (CRTL.) and in patients with MASLD via western blotting (n = 12). r, Serum IL-32γ levels in the control group and in patients with MASLD were measured via ELISA. s, Correlations between the serum levels of IL-32γ, ALT and AST in the control group and in patients with MASLD. The data are presented as the means ± s.d.; *,#P < 0.05, **,##P < 0.01, ***,###P < 0.001 and ****,####P < 0.0001 versus the control model. ns, not significant.
Fig. 8
Fig. 8. PR3-dependent proteolytic degradation and cleavage of IL-32γ contribute to the activation of KCs and HSCs.
a, Relative mRNA expression of proinflammatory genes in primary KCs from IL-32γ Tg mice co-stimulated with LPS and A1AT KO HCM or WT HCM. b, Immunoblot analysis of PR3-mediated cleavage and degradation of rhIL-32γ in the presence of phosphate-buffered saline (PBS) at different time points at 37 °C. c, Proteolytic process of IL-32γ in CM from IL-32γ (WT)- and IL-32γ (V104A)-overexpressing ImKCs stimulated with LPS, as determined via an immunoblot assay. Each CM was concentrated via a concentrator (4,000 rpm for 25 min at 4 °C). d, Relative mRNA expression of proinflammatory genes in ImKCs treated with CM from LPS- and sivelestat-treated EV ImKCs, IL-32γ (WT) ImKCs and IL-32γ (V104) ImKCs. e, A schematic diagram illustrating the hypothesis that PR3-mediated IL-32γ (WT) cleavage induces immune responses, whereas the anti-inflammatory effect of IL-32γ (V104A) is maintained. f, Immunoblot analysis of the cleavage of rhIL-32γ by PR3 in the presence of sivelestat. rhIL-32γ was preincubated with PR3 for 5 min at 37 °C, and the reaction was stopped with a serine protease inhibitor. g, Relative mRNA expression of proinflammatory genes in ImKCs treated with rhIL-32γ, PR3 and sivelestat. h,i, Relative mRNA expression of M1 and M2 markers in primary KCs co-treated with LPS or the full-length (FL)-rhIL-32γ (100 ng/ml), C-terminal (100 ng/ml) or N-terminal (100 ng/ml) domain of IL-32γ. j, Detection of TNF in the CM of primary KCs co-treated with LPS, FL-rhIL-32γ (100 ng/ml), the C-terminal domain (100 ng/ml) or the N-terminal domain (100 ng/ml) of IL-32γ. k, Immunoblot analysis of p-JNK, JNK, p-ERK, ERK, p-IκB-α, IκB-α, p-p65, p65 and actin protein levels in ImKCs stimulated with LPS with or without the C-terminal cleaved form of IL-32γ. l, Graphical figure showing that the cleaved c-terminal domain of IL-32γ by PR3 contributes to the M1 polarization of KCs. m, Relative mRNA expression of profibrogenic genes in primary HSCs in the quiescent state (after 1 day of culture) and activated state (after 3 days of culture) stimulated with FL-rhIL-32γ (100 ng/ml) and the C-terminus (100 ng/ml). n, The graphical representation illustrates that the cleavage of IL-32γ fails to prevent the activation of HSCs. The data are presented as the means ± s.d.; *,#P < 0.05, **,##P < 0.01, ***,###P < 0.001 and ****,####P < 0.0001 versus the control model. ns, not significant.

References

    1. Rinella, M. E. et al. A multisociety Delphi consensus statement on new fatty liver disease nomenclature. Hepatology78, 1966–1986 (2023). - PMC - PubMed
    1. Cohen, J. C., Horton, J. D. & Hobbs, H. H. Human fatty liver disease: old questions and new insights. Science332, 1519–1523 (2011). - PMC - PubMed
    1. Estes, C., Razavi, H., Loomba, R., Younossi, Z. & Sanyal, A. J. Modeling the epidemic of nonalcoholic fatty liver disease demonstrates an exponential increase in burden of disease. Hepatology67, 123–133 (2018). - PMC - PubMed
    1. Ibrahim, S. H., Hirsova, P. & Gores, G. J. Non-alcoholic steatohepatitis pathogenesis: sublethal hepatocyte injury as a driver of liver inflammation. Gut67, 963–972 (2018). - PMC - PubMed
    1. Jezela-Stanek, A. & Chorostowska-Wynimko, J. Beyond the lungs: alpha-1 antitrypsin’s potential role in human gestation. Adv. Clin. Exp. Med. 28, 1257–1261 (2019). - PubMed