. 2025 Mar;22(3):316-329.
doi: 10.1038/s41423-025-01259-w. Epub 2025 Feb 13.

Uncovering two neutrophil-committed progenitors that immediately precede promyelocytes during human neutropoiesis

Affiliations

Uncovering two neutrophil-committed progenitors that immediately precede promyelocytes during human neutropoiesis

Ilaria Signoretto et al. Cell Mol Immunol. 2025 Mar.

Abstract

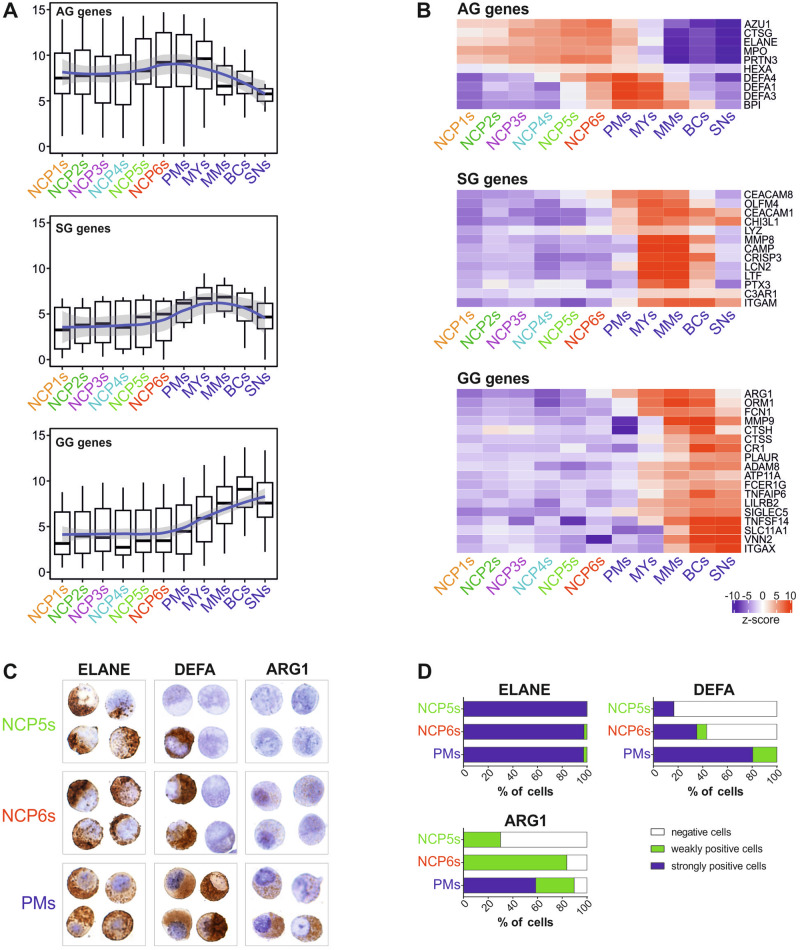
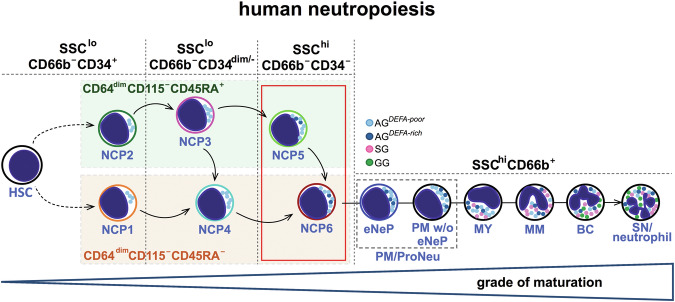
Technological advances have greatly improved our knowledge of myelopoiesis, for example, with the discovery of granulocyte‒monocyte‒dendritic cell (DC) progenitors (GMDPs), monocyte‒DC progenitors (MDPs), common DC progenitors (CDPs) and common monocyte progenitors (cMoPs) on the basis of flow cytometry approaches. Concomitantly, some progress has been made in characterizing the very early phases of human neutropoiesis with the description of novel CD66b+ progenitors, including eNePs, PMs w/o eNePs, ProNeus, and PreNeus. More recently, we identified four SSCloLin-CD66b-CD45dimCD34+/CD34dim/-CD64dimCD115- cells as the earliest precursors specifically committed to the neutrophil lineage present in human bone marrow (BM), which we called neutrophil-committed progenitors (NCPs, from NCP1s to NCP4s). In this study, we report the isolation and characterization of two new SSChiCD66b-CD64dimCD115-NCPs that, by phenotypic, transcriptomic, maturation and immunohistochemistry properties, as well as by flow cytometric side-scattered light (SSC), stand after NCP4s but precede promyelocytes during the neutropoiesis cascade. Similar to SSCloCD45RA+NCP2s/NCP3s and SSCloCD45RA-NCP1s/NCP4s, these cells exhibit phenotypic differences in CD45RA expression levels and, therefore, were named SSChiCD45RA+NCP5s and SSChiCD45RA-NCP6s. Moreover, NCP5s were more immature than NCP6s, as determined by cell differentiation and proliferative potential, as well as by transcriptomic and phenotypical features. Finally, by examining whether NCPs and all other CD66b+ neutrophil precursors are altered in representative hematological malignancies, we found that, in patients with chronic-phase chronic myeloid leukemia (CP-CML), but not with systemic mastocytosis (SM), there is an increased frequency of BM NCP4s, NCP6s, and all downstream CD45RA-negative neutrophil progenitors, suggesting their expansion in CML pathogenesis. Taken together, our data advance our knowledge of human neutropoiesis.

Keywords: Chronic myeloid leukemia; G-CSF; Neutrophils; Neutrophil progenitors; Neutropoiesis.


Conflict of interest statement

Competing interests: The authors declare no competing interests.

Figures

Fig. 1
Fig. 1
Identification of NCP5s and NCP6s in BM-LDCs. A Flow cytometry gating strategy illustrating how to identify Lin-SSChiCD66b-CD11b-CD16-CD64dimCD115-CD117+CD71hiCD45RA+NCP5 (panel VII, light green gate) and Lin-SSChiCD66b-CD11b-CD16-CD64dimCD115-CD117+CD71hiCD45RA-NCP6 (panel VII, red gate) within the SSChiCD45+ cells in BM-LDCs (panel I), after the exclusion of mature CD16-eosinophils (panel II), mature CD11b+neutrophils (panel III), immature CD64+monocytes (panel IV), CD117-CD71dim/hiPM w/o eNePs (panel V, yellow gate) and CD71+CD117+CD66b+eNePs (panel VI, blue gate). The bottom panels show the identification of SSClowCD66b-CD34+CD64dimCD115-CD45RA- NCP1s (panel VIII, orange gate), SSClowCD66b-CD34+CD64dimCD115-CD45RA+ NCP2s (panel IX, green gate), SSClowCD66b-CD34dim/-CD64dimCD115-CD45RA+ NCP3s (panel X, magenta gate) and SSClowCD66b-CD34dim/-CD64dimCD115-CD45RA- NCP4s (panel XI, light blue gate). One representative experiment (out of 10 performed, with similar results) is shown. B Histograms depicting the expression of CD15, CD38, CD49d, CD71, and CD117, as well as that of SSC-A, by total CD45+BM-LDC cells, NCP3s, NCP4s, NCP5s, NCP6s, eNePs and PMs w/o eNePs, as defined in panel (A). The data are representative of 1 of 5 independent experiments, with similar results. C Morphology of purified NCPs and PMs. Sorted NCP5s, NCP6, and PMs were stained via the May-Grunwald procedure
Fig. 2
Fig. 2
Phenotypic comparison of ProNeus with NCP5s, NCP6s, eNePs, and PMs w/o eNePs by flow cytometry. A Flow cytometry gating strategy to identify the ProNeus in SSChiLin-CD45+ cells in BM-LDCs (panel II, green gate) according to their CD66b+CD49d+CD11b- phenotype. B Plots showing how ProNeus (green dots as defined in A) overlay PMs w/o eNePs (yellow gate), eNePs (blue gate), NCP5s (light green gate) and NCP6s (red gate), as defined by the gating strategy illustrated in Fig. 1. C Contour plot overlays highlighting the differences among NCP5s, NCP6s, eNePs, PM w/o eNePs and ProNeus in terms of the SSC-A parameter and CD66b expression. The data are representative of 1 of 4 independent experiments, with similar results
Fig. 3
Fig. 3
Differentiation of NCP5s and NCP6s into CD66+ cells. A Representative flow cytometry gating strategy used to analyze CD66b+ cells derived from NCP5s and NCP6s cultured with SFGc for 5 days (n = 10). Plots showing the identification of basophils (bordeaux gate), monocytes (light blue gate), eosinophils (orange gate) and undifferentiated cells (gray gate), as well as PMs (beige gate), MYs (pink gate), MMs (light red gate), BCs (red gate) and SNs (dark red gate) within the CD66b+ cells (green gate). B Bar graphs showing the percentages of CD66b+ cells (green contour, mean ± s.e.m. refers to total CD45+ cells, n = 10), eosinophils (orange contour), basophils (bordeaux contour), monocytes (light blue contour) and undifferentiated cells (gray contour) derived from NCP5s and NCP6s cultured for 5 days with SFGc. C Bar graphs showing the percentages of CD66b+PMs (beige contour), MYs (pink contour), MMs (light red contour), BCs (red contour) and SNs (dark red contour) derived from NCP3s, NCP4s, NCP5s and NCP6s cultured for 5 days with SFGc (mean ± s.e.m., n = 5 for NCP3s and NCP4s; n = 10 for NCP5s and NCP6s). D Bar graph representing the generation of SNs (alias CD10+ cells) from NCP3s, NCP4s, NCP5s and NCP6s treated with SFGc for 5 days (mean ± s.e.m., n = 5 for NCP3s and NCP4s; n = 10 for NCP5s and NCP6s). E Bar graph displaying the fold expansion of purified NCP3s, NCP4s, NCP5s and NCP6s treated with SFGc for 5 days (mean ± s.e.m., n = 5 for NCP3s and NCP4s; n = 10 for NCP5s and NCP6s). D, E Statistical analysis was performed via one-way ANOVA and Tukey’s post hoc test. * = p < 0.05, ** = p < 0.01, *** = p < 0.001
Fig. 4
Fig. 4
RNA-seq experiments revealed that NCP5s and NCP6s precede conventional PMs during neutropoiesis. A PCA scatter plot based on the DEGs identified from bulk RNA-seq analyses of NCP5s (light green) and NCP6s (red) as well as NCP1s (orange), NCP2s (green), NCP3s (magenta) and NCP4s (turquoise), PMs, MYs, MMs, BCs and SNs (n = 3–6). B Developmental paths of NCPs and other CD66b+ cells computationally determined from bulk RNA-seq datasets via the optimal leaf ordering (OLO) algorithm. C PCA scatter plot (as in panel A) focused exclusively on all NCPs and PMs. D Heatmap displaying the expression patterns of the gene modules (m1–m10) resulting from the k-means analysis of DEGs identified among the various neutrophil-lineage cells. The median gene expression levels of the biological replicates were calculated, and the data were represented as z scores. The relevant genes for each module are listed on the right
Fig. 5
Fig. 5
Transcriptional and immunocytochemical analyses of the expression profiles of representative azurophilic, specific, and gelatinase granule proteins in NCP5s and NCP6s. A Box plots showing the distribution of mRNA expression levels [log2(FPKM + 1)] of genes associated with AG, SG and GG. The box plot shows the median with the lower and upper quartiles representing the 25th to 75th percentile range and whiskers extending to the 1.5 × interquartile range (IQR). LOESS fitting of the data with a relative confidence interval is represented by a blue line with a shadow area. B Heatmaps showing the expression levels of selected genes encoding typical azurophilic, specific, and gelatinase granule proteins. The median gene expression levels of the biological replicates (n = 3--6) were calculated, and the data were represented as z scores. C, D Expression of antigenic elastase (ELANE), α-defensins (DEFAs) and arginase-1 (ARG1) by immunocytochemical staining of NCP5s, NCP6s and PMs. C Four representative stained cells for each cell population are shown. Original magnification, ×600. D Stacked bar graph displaying the percentage of cells showing negative (white), weakly positive (green), or strongly positive (blue) immunocytochemical staining for ELANE, DEFA and ARG1 by specific antibodies
Fig. 6
Fig. 6
Evidence for the ability to generate both NCP5s and NCP6s via NCP3s and NCP6s via NCP4s. Flow cytometry histograms displaying the CD45RA, CD117, CD11b, CD15, and CD66b expression levels (A), as well as the SSC-A parameter (B), of the cells derived from NCP3s and NCP4s cultured with SFGc for 0, 2, 3, 5, and 7 days. The data are representative of 1 out of 4 independent experiments performed with similar results. C Box plots illustrating CD66c mRNA expression levels in NCP3s (n = 6), NCP4s (n = 6), NCP5s (n = 3), and NCP6s (n = 3). The box plot shows the median with the lower and upper quartiles representing the 25th to 75th percentile range and whiskers extending to the 1.5X interquartile range (IQR). D Flow cytometry histograms showing CD66c and CD45RA expression by NCP3s, NCP4s, NCP5s, and NCP6s within BM-LDCs. One representative experiment out of 4 is shown. E Flow cytometry plots displaying the generation from NCP3s of CD66b-CD71+CD117+CD45RA+CD66c-/+NCP5s (green gate and histogram filled in green), CD66b-CD71+CD117+CD45RA-CD66c++NCP6s (red gate and histogram filled in red) after 3 days, and CD66b-CD71+CD117+CD45RA-CD66c+/- NCP4s (histogram with dotted line in light blue) after 2 days. Flow cytometry plots displaying the generation of CD66b-CD71+CD117+CD45RA-CD66c++ NCP6s from either NCP4s (F) or NCP5s (G) after 2 days of culture with SFGc. Panels IV of (EG) display CD66c expression (dotted black lines) by freshly isolated (T0) NCP3s, NCP4s and NCP5s used as internal controls. E–G Representative data from 3 experiments with similar results are shown
Fig. 7
Fig. 7
Flow cytometry and immunohistochemistry analysis of neutrophil progenitors in the BM-LDCs of HDs, CP-CML patients, and SM patients. A Frequencies of NCP1s, NCP2s, NCP3s, NCP4s, NCP5s, NCP6s, PMs, MYs, MMs and BCs in CD45+ bone marrow-low density cells (BM-LDCs) from HDs (n = 8, gray line), CP-CML patients (n = 13, blue line) and SM patients (n = 6, light yellow). B Bar graph highlighting NCP5s and NCP6s, as reported in panel (A), from HDs (gray contour) and CP-CML patients (blue contour) in CD45+BM-LDCs. C Bar graph showing the frequency of NCP1s, NCP2s, NCP3s, and NCP4s in the narrower area defined as CD34+/CD34dim/- cells in HDs (n = 8, gray contour) compared with those in CP-CML patients (n = 15, blue contour). D, E Bar graph showing the frequency of cGMPs, cMoPs and MDPs in CD34+/CD34dim/- cells from HDs (n = 8, gray contours) compared with those from CP-CML patients (n = 14, blue contours). A, C, D Data are presented as the means ± s.e.m.s. Statistical analysis was performed via the Mann‒Whitney test. * = p < 0.05, ** = p < 0.01, *** = p < 0.001, **** = p < 0.0001. Human FFPE BM sections from (F) HDs (n = 3) and (G) CP-CML patients (n = 3) were immunostained as indicated. Fewer neutrophil precursors (based on larger and round nuclei) are found in normal tissue than in CP-CML tissue. Numerous NCP4s and NCP6s are instead identifiable in BM CP-CML, as indicated by the colored asterisks (turquoise for NCP4, green for NCP5 and red for NCP6)
Fig. 8
Fig. 8
Our current model concerning the early phases of human neutropoiesis. The identification of SSChiCD66b-CD45RA+NCP5s and SSChiCD66b-CD45RA-NCP6s (boxed in red in the scheme) allows us to update our proposed model of human neutropoiesis [4]. At its very early stages, in fact, neutropoiesis includes SSCloNCPs (i.e., NCP1s, NCP2s, NCP3s, NCP4s), then SSChiNCPs (i.e., NCP5s and NCP6s), followed by eNePs and PM w/o eNePs (that form the PM), as depicted in the scheme. The arrows define the differentiation hierarchies of the individual NCPs to the PM

References

    1. Karamitros D, Stoilova B, Aboukhalil Z, Hamey F, Reinisch A, Samitsch M, et al. Single-cell analysis reveals the continuum of human lympho-myeloid progenitor cells. Nat Immunol. 2018;19:85–97. - PMC - PubMed
    1. Weinreb C, Rodriguez-Fraticelli A, Camargo FD, Klein AM. Lineage tracing on transcriptional landscapes links state to fate during differentiation. Science. 2020;367:eaaw3381. - PMC - PubMed
    1. Velten L, Haas SF, Raffel S, Blaszkiewicz S, Islam S, Hennig BP, et al. Human hematopoietic stem cell lineage commitment is a continuous process. Nat Cell Biol. 2017;19:271–81. - PMC - PubMed
    1. Calzetti F, Finotti G, Cassatella MA. Current knowledge on the early stages of human neutropoiesis. Immunol Rev. 2023;314:111–24. - PubMed
    1. Calzetti F, Finotti G, Tamassia N, Bianchetto-Aguilera F, Castellucci M, Cane S, et al. CD66b(-)CD64(dim)CD115(-) cells in the human bone marrow represent neutrophil-committed progenitors. Nat Immunol. 2022;23:679–91. - PubMed