Where is the hard-to-reach population? Spatial analysis from a cross-sectional study on the access to bed net and malaria vaccine in the Lake Victoria Region, Kenya
- PMID: 39939989
- PMCID: PMC11823133
- DOI: 10.1186/s12936-025-05280-2
Where is the hard-to-reach population? Spatial analysis from a cross-sectional study on the access to bed net and malaria vaccine in the Lake Victoria Region, Kenya
Abstract
Background: Long-lasting insecticidal nets (LLIN) and vaccines are effective malaria control tools. However, inadequate uptake has been reported in countries where both interventions are available. To maximize the impact these tools provide, it is crucial to identify populations that are not being reached and the barriers to uptake.
Methods: In a cross-sectional study conducted in April 2024 in Kanyamwa Kologi Ward in Homa Bay County, Kenya, 4,662 households in 58 randomely selected villages were visited and interviewed. The proportions of households that (1) received at least one new LLIN within the previous five months (net distribution), (2) reported all children used LLIN (net usage), (3) reported at least one child had received one dose of the RTS,S vaccine (vaccine uptake), and (4) reported all children had received four doses of the vaccine (vaccine completion) were examined. Bayesian spatial autoregression analyses were used to estimate adjusted odds ratio (aOR) and its credible intervals (CrI) to identify the association between the household-level characteristics and the four outcomes.
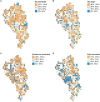
Results: The overall uptake proportions were 89.9% for net distribution, 84.4% for net usage, 88.2% for vaccine uptake, and 53.7% for vaccine completion. All four outcomes showed geographical heterogeneity with significant (p < 0.05) Moran's I. Households headed by adults of > 40 years had higher odds of having received a new LLIN (aOR = 2.02, 95% CrI 1.02-5.42), having one child who had received one vaccine dose (aOR = 1.83, 0.69-4.66), and having all children fully vaccinated (aOR = 2.36, 1.09-5.46), but lower odds of net usage by all children (aOR = 0.62, 0.40-0.96). Households with five or more children had higher odds of having received a new LLIN (aOR = 5.36, 2.24-27.0) but lower odds of net usage by all children (aOR = 0.24, 0.14-0.38) and having all children fully vaccinated (aOR = 0.20, 0.04-0.61). Distance to the nearest health centre was negatively associated with all outcomes. Household wealth was positively associated with all outcomes.
Conclusion: Uptake of LLIN and malaria vaccine in Homa Bay County, Kenya varied by geography and household characteristics. These findings suggest that different sets of actions should be considered to improve the coverage and compliance of these interventions in different areas.
Keywords: Access; Kenya; LLIN; Malaria vaccine; Mass net distribution; RTS,S; Spatial analysis; Vaccine uptake.
© 2025. The Author(s).
Conflict of interest statement
Declarations. Competing interests: The authors declare no competing interests.
Figures


References
-
- WHO. World malaria report 2023. Geneva: World Health Organization; 2023.
-
- Dhorda M, Kaneko A, Komatsu R, Kc A, Mshamu S, Gesase S, et al. Artemisinin-resistant malaria in Africa demands urgent action. Science. 2024;385:252–4. - PubMed
-
- WHO. Global technical strategy for malaria 2016–2030. Geneva: World Health Organization; 2016.
MeSH terms
Substances
Grants and funding
LinkOut - more resources
Full Text Sources
Medical
Miscellaneous

