. 2025 Jan 28;26(3):1138.
doi: 10.3390/ijms26031138.

Integrated Computational Analysis Reveals Early Genetic and Epigenetic AML Susceptibility Biomarkers in Benzene-Exposed Workers

Affiliations

Integrated Computational Analysis Reveals Early Genetic and Epigenetic AML Susceptibility Biomarkers in Benzene-Exposed Workers

Silvia Vivarelli et al. Int J Mol Sci. .

Abstract

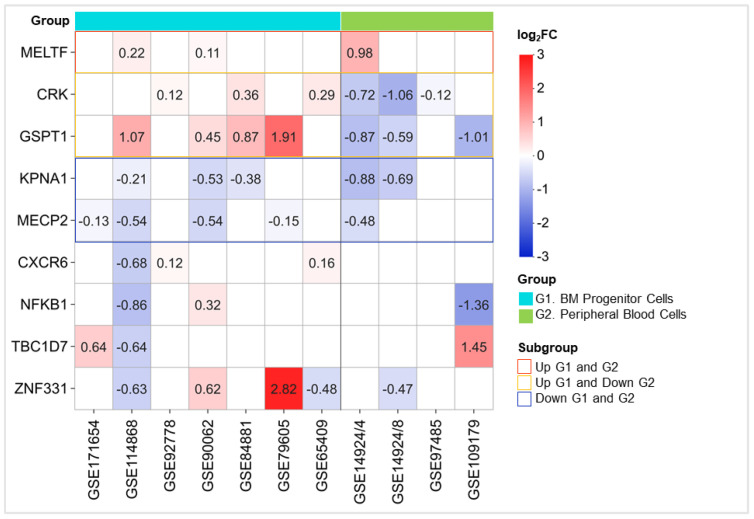
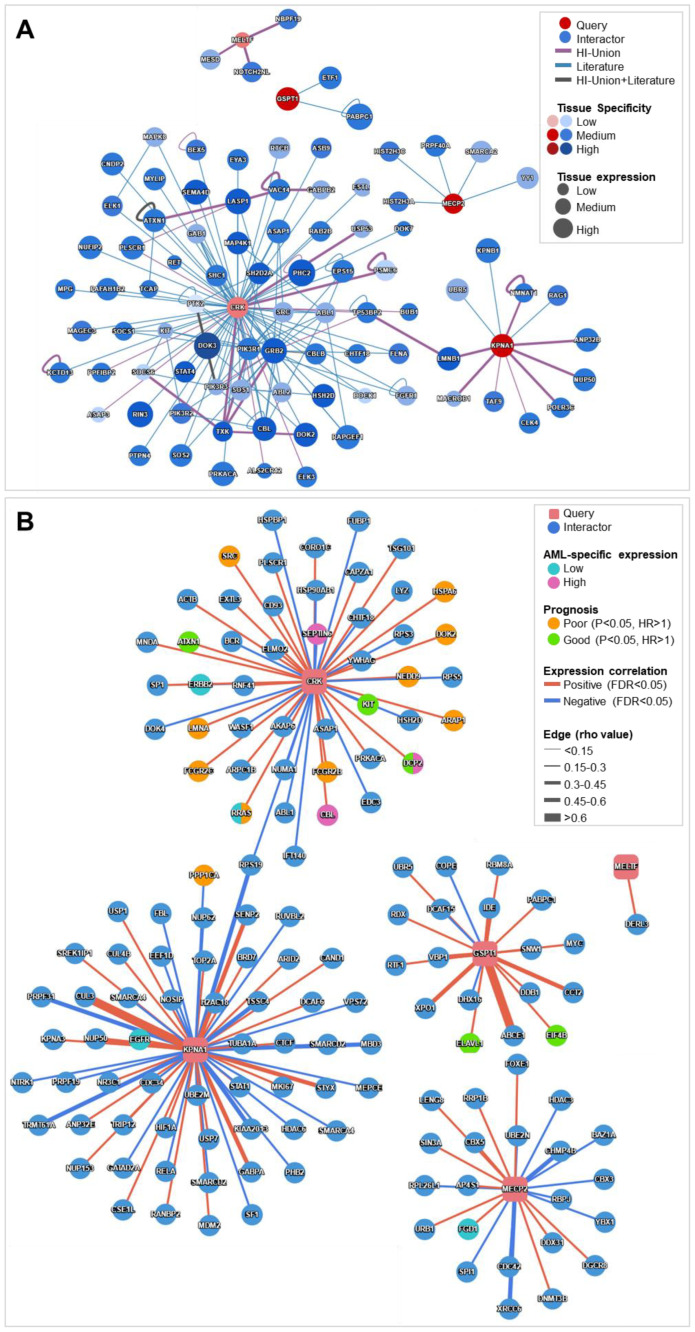
Benzene, a well-known carcinogenic airborne pollutant, poses significant health risks, particularly in industries such as petroleum, shoemaking, and painting. Despite strict regulations, chronic occupational exposure persists, contributing to the onset of acute myeloid leukemia (AML) and other malignancies. Benzene's carcinogenicity stems from its metabolic activation, leading to increased oxidative stress, DNA damage, and cancer transformation. While its toxicity is well-documented, the link between genetic and epigenetic alterations and cancer susceptibility in exposed workers remains underexplored. This study aims to identify early biomarkers of benzene exposure and AML risk by analyzing gene expression and DNA methylation datasets from GEO DataSets, integrated with molecular pathway analyses, as well as miRNA-target and protein-protein network evaluations. This multi-approach led to the identification of nine deregulated genes (CRK, CXCR6, GSPT1, KPNA1, MECP2, MELTF, NFKB1, TBC1D7, ZNF331) in workers exposed to benzene, with NFKB1 showing strong discriminatory potential. Also, dose-dependent DNA methylation changes were observed in CXCR6 and MELTF, while selected miRNAs such as let-7d-5p, miR-126-3p, and miR-361-5p emerged as key post-transcriptional regulators. Furthermore, functional enrichment linked these genes to immune response, inflammation, cell proliferation, and apoptosis pathways. While network analyses highlighted NFKB1, CRK, and CXCR6 as central to benzene-associated leukemogenesis. Altogether, these findings provide novel insights into an early biomarker fingerprint for benzene exposure and AML susceptibility, supporting the future development of biomolecular-based targeted occupational health monitoring and personalized preventive strategies for at-risk workers.

Keywords: DNA methylation; acute myeloid leukemia; benzene exposure; computational study; gene expression; miRNA regulatory network; occupational biomarkers; occupational health; risk assessment.


Conflict of interest statement

The authors declare no conflicts of interest.

Figures

Figure 1
Figure 1
Differential expression analyses in the two GEO DataSets. (A) Volcano plots representing transcriptional expression data from GSE21862 (left) and GSE9569 (right). Light blue dots represent genes significantly downregulated (DR) in benzene-exposed versus non-exposed workers, while orange dots represent genes significantly upregulated (UR) in benzene-exposed versus non-exposed workers. Grey dots represent genes with non-significant (NS) changes. (B) Venn diagram illustrating the overlap of genes unique to each dataset and those shared between the datasets. (C) The bubble plot displays the relative expression of 12 significantly deregulated genes, with the size and color of the circles indicating the mean log2 expression values (log2expr.). (D) Heatmap of the averaged log2 fold change (log2FC) for each of the 12 genes across the two datasets. (E) Box plots showing the median expression levels ± SD of the 9 genes consistently upregulated in both datasets. *** p < 0.001; **** p < 0.0001.
Figure 2
Figure 2
Stratification of significantly deregulated genes in GSE21862 based on benzene exposure. Box plots showing the median expression levels ± SD of the 9 benzene-related genes. Workers were stratified into low-dose benzene exposure (BZN-L: 0.1–5 ppm), high-dose benzene exposure (BZN-H: >5 ppm, including exposures exceeding 10 ppm), and non-exposed controls (CTR). * p < 0.05; ** p < 0.01; *** p < 0.001; **** p < 0.0001; ns = not significant.
Figure 3
Figure 3
Correlation of the expression of significantly deregulated genes. Correlograms of Spearman correlations and Mantel analysis between deregulated benzene-related genes. (A) In the GSE21862 dataset, comparing CTR (control, left) and BNZ (benzene-exposed, right) samples. (B) In the GSE9569 dataset, comparing CTR (left) and BNZ (right) samples. Light red color within cells indicates positive correlations (rho values between 0 and 1), while light blue color indicates negative correlations (rho values between 0 and −1). The size of the squares in each cell is proportional to the magnitude of the rho value. Only significant correlations with p-values < 0.05 are reported. The lines denote Mantel test results, with the line width representing Mantel’s r statistic and the color representing Mantel significance (Mantel’s p). * p < 0.05; ** p < 0.01; *** p < 0.001; and **** p < 0.0001.
Figure 4
Figure 4
ROC curve analysis to assess the validity of gene expression in discriminating between benzene-exposed and non-exposed worker samples. ROC plots for the GSE21862 (light blue) and GSE9569 (orange) datasets are shown, with a corresponding table displaying the AUC and p-value for each of the nine benzene-associated genes. The AUC values reflect the discriminatory power of the genes in distinguishing exposed and non-exposed workers, with a higher AUC indicating stronger predictive capability.
Figure 5
Figure 5
DNA methylation dataset analysis (GSE50967). (A) Box plots showing the median DNA methylation levels ± SD of CRK (cg15043106), CXCR6 (cg08450017), MELTF (cg16446585), and MELTF (cg10670430) in BNZ-L (low exposure to benzene: 0.06 ± 0.01 mg/m3, equivalent to 0.02 ppm), BNZ-H (high exposure to benzene: 7.68 ± 2.57 mg/m3, equivalent to 2.59 ppm), and CTR (non-exposed controls: 0.06 ± 0.01 mg/m3, equivalent to 0.02 ppm). (B) Heatmap of the mean DNA methylation levels of the five most deregulated DNA methylation hotspots, grouped into BNZ-L (L1-4), BNZ-H (H1-4), and CTR (C1-4). (C) Table reporting the main features of DNA methylation hotspots, including the gene ID, gene name, gene accession, methylation level, CpG island status, F-value, and FDR. * p < 0.05; *** p < 0.001; and ns = not significant.
Figure 6
Figure 6
Gene expression matrix of 9 benzene-associated genes in AML GEO gene expression datasets. Boxes represent the averaged log2 fold change (log2FC) for each of the 9 genes. Red boxes indicate upregulated genes with log2FC between 0 and 3, while blue boxes represent downregulated genes with log2FC between 0 and −3. Unfilled white boxes indicate genes with non-significant fold changes. The datasets are grouped into G1 (light blue) with bone marrow (BM) progenitor cell-derived samples and G2 (light green) with peripheral blood nucleated cell-derived samples. MELTF is consistently upregulated in both G1 and G2 (red boxes), while CRK and GSPT1 show upregulation in G1 but downregulation in G2 (yellow boxes). KPNA1 and MECP2 are consistently downregulated in both G1 and G2 (blue boxes).
Figure 7
Figure 7
g:GOSt and STRING functional network analyses of the panel of nine differentially expressed benzene-related genes. (A) Table summarizing the multi-query results with significant FDR values for 14 Biological Process Gene Ontology (BP:GO) terms, 1 Kyoto Encyclopedia of Genes and Genomes (KEGG) pathway, and 1 WikiPathways (WP) pathway. Square colors indicate different types of evidence, as described in the bottom of the table. (B) STRING plot showing protein–protein associations, where edges represent interactions between proteins and nodes represent the query proteins and their first shell of interactors. The colors of the edges, as well as the node clusters, are indicated in the figure.
Figure 8
Figure 8
Protein-protein interaction networks for five benzene-associated genes consistently deregulated in AML samples. (A) Protein interaction network generated using the Human Reference Interactome (HuRI) in blood tissue. (B) Protein interaction network generated using the Protein Interaction Network Analysis (PINA 3.0) platform, in the context of AML (The Cancer Genome Atlas, TCGA dataset). Color codes for edges and nodes in both networks are specified within the figure (upper left).
Figure 9
Figure 9
miRNet miRNA-target interaction network of differentially expressed benzene-related gene targets. (A) Network plots highlighting the interactions (grey nodes) between the 9 benzene-associated gene targets and 8 miRNAs in bone marrow (left), peripheral blood (center), and exosome (right) samples. (B) Venn diagram showing intersections between miRNet queries and a table listing miRNAs that are post-transcriptional regulators of benzene-related gene targets belonging to each Venn subgroup. (C) Network plot depicting the interactions (grey nodes) between 5 benzene- and AML-associated gene targets and 38 miRNAs; miRNAs specifically involved in AML pathology are highlighted in green and yellow. (D) Network plot of 5 benzene- and AML-associated gene targets and 9 miRNAs of the AML-disease subgroup, with interactions (grey nodes).

Similar articles

References

    1. Loomis D., Guyton K.Z., Grosse Y., El Ghissassi F., Bouvard V., Benbrahim-Tallaa L., Guha N., Vilahur N., Mattock H., Straif K. Carcinogenicity of benzene. Lancet Oncol. 2017;18:1574–1575. doi: 10.1016/S1470-2045(17)30832-X. - DOI - PubMed
    1. Wang J., Ma Y., Tang L., Li D., Xie J., Sun Y., Tian Y. Long-Term Exposure to Low Concentrations of Ambient Benzene and Mortality in a National English Cohort. Am. J. Respir. Crit. Care Med. 2024;209:987–994. doi: 10.1164/rccm.202308-1440OC. - DOI - PubMed
    1. Wang T., Cao Y., Xia Z., Christiani D.C., Au W.W. Review on novel toxicological effects and personalized health hazard in workers exposed to low doses of benzene. Arch. Toxicol. 2024;98:365–374. doi: 10.1007/s00204-023-03650-w. - DOI - PubMed
    1. IARC Working Group on the Evaluation of Carcinogenic Risks to Humans . Benzene—IARC Monographs on the Evaluation of Carcinogenic Risks to Humans, No. 120. World Health Organization; Geneve, Switzerland: 2018.
    1. European Parliament. Council of the European Union Directive (EU) 2022/431 of the European Parliament and of the Council of 9 March 2022 amending Directive 2004/37/EC on the protection of workers from the risks related to exposure to carcinogens or mutagens at work. Off. J. Eur. Union. 2022;50:1–14.

MeSH terms

LinkOut - more resources