. 2025 Jan 29;26(3):1181.
doi: 10.3390/ijms26031181.

A Non-Pharmacological Paradigm Captures the Complexity in the Mechanism of Action of Poliprotect Against Gastroesophageal Reflux Disease and Dyspepsia

Affiliations

A Non-Pharmacological Paradigm Captures the Complexity in the Mechanism of Action of Poliprotect Against Gastroesophageal Reflux Disease and Dyspepsia

Sara Caterbi et al. Int J Mol Sci. .

Abstract

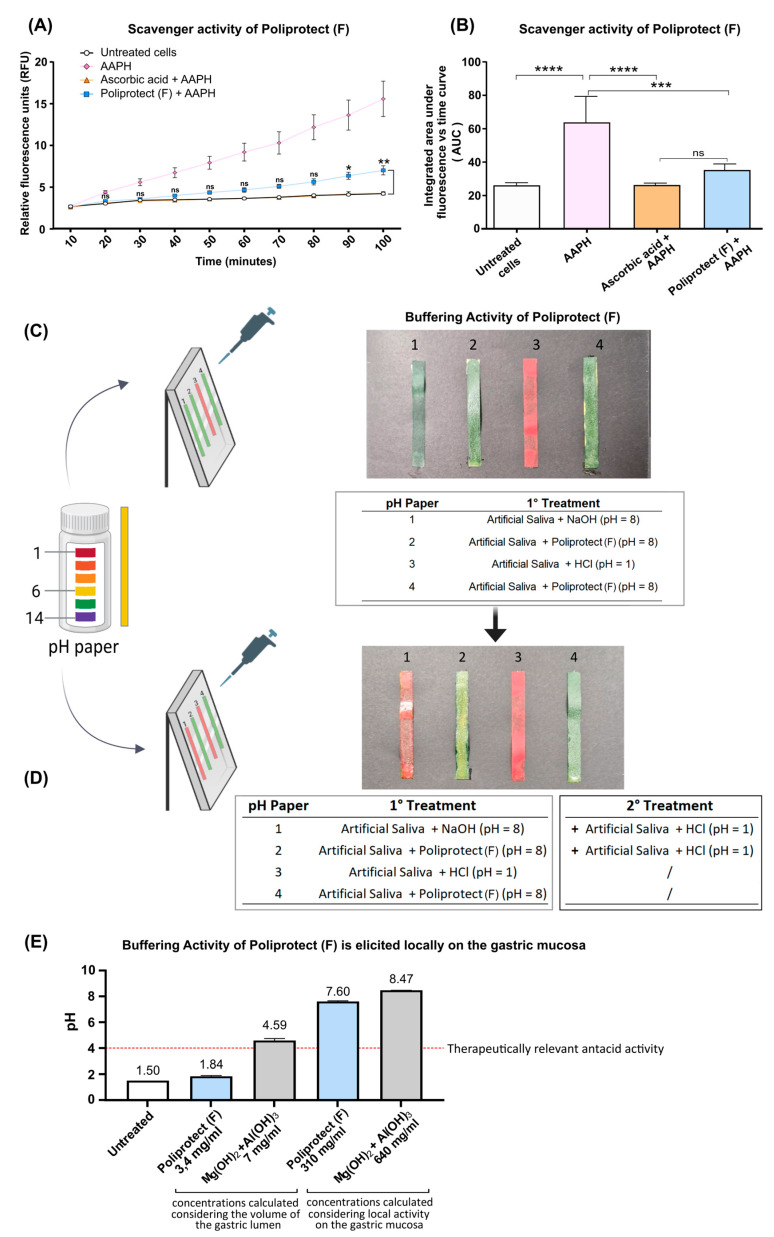
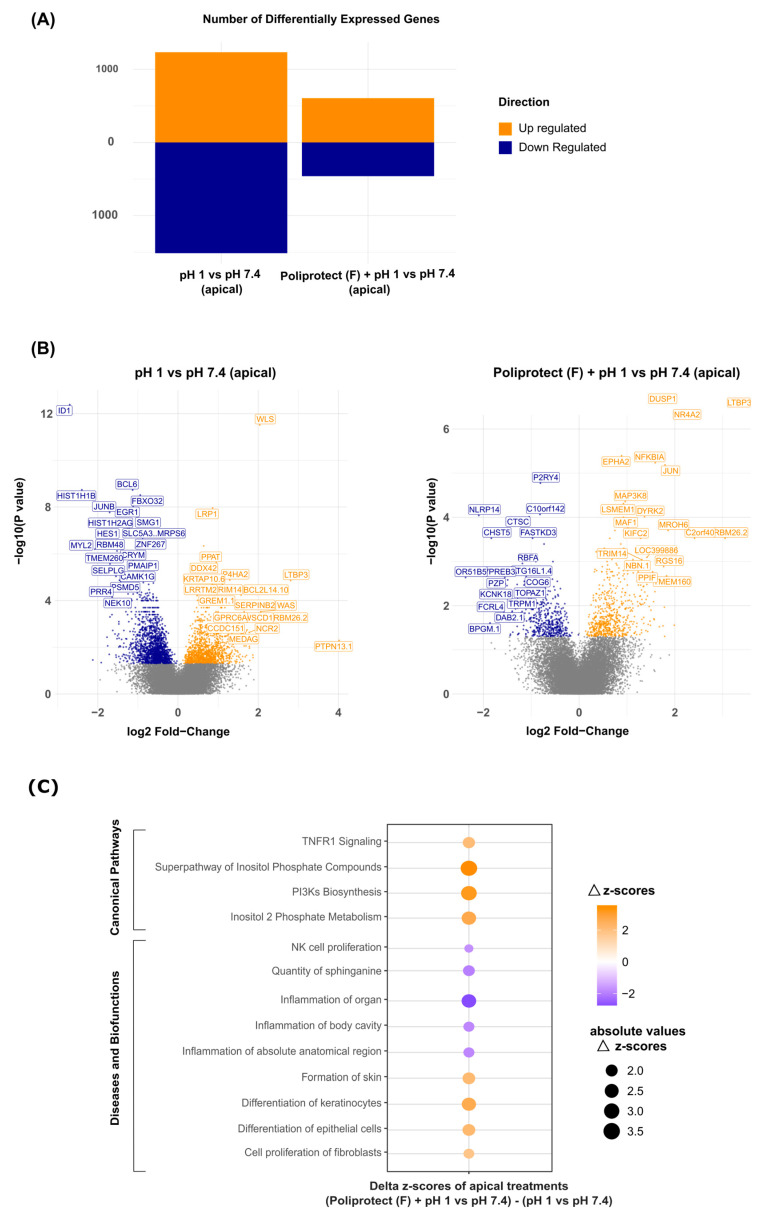
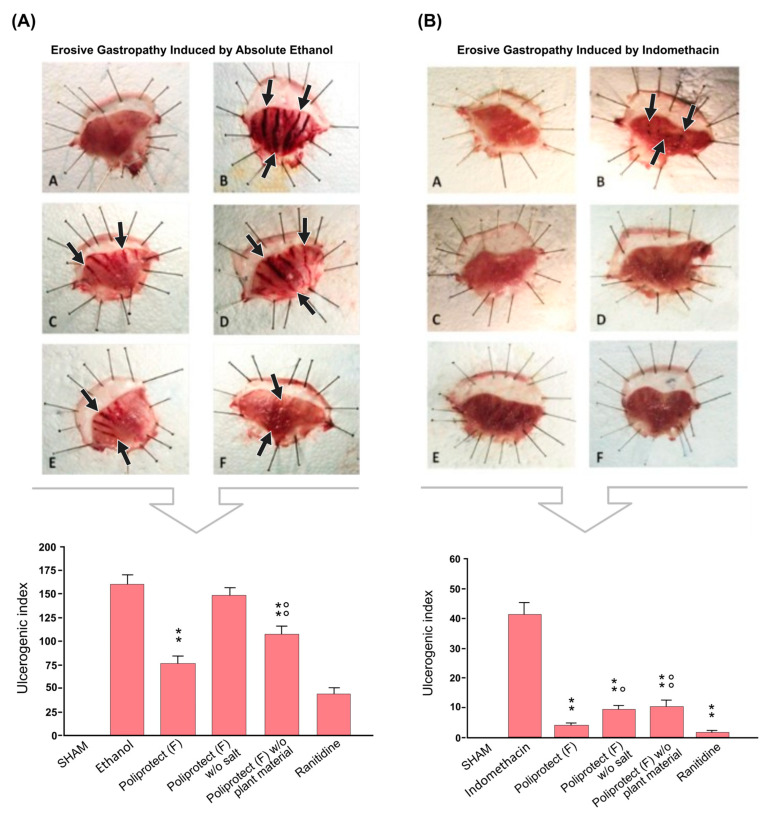
When the protective mechanisms of the gastroesophageal mucosa are overwhelmed by injurious factors, the structural and functional mucosal integrity is compromised, resulting in a wide spectrum of disorders. Poliprotect has recently been shown to be non-inferior to standard-dose omeprazole for the treatment of endoscopy-negative patients with heartburn and/or epigastric pain or burning. Here, we provide preclinical data describing the mechanism of action of the Poliprotect formulation, a 100% natural, biodegradable, and environmental friendly medical device according to EU 2017/745 and containing UVCB (unknown or variable composition, complex-reaction products, or biological materials) substances of botanical and mineral origin, according to the REACH and European Chemical Agency definitions. Different in vitro assays demonstrated the capability of Poliprotect to adhere to mucus-secreting gastric cells and concomitantly deliver a local barrier with buffering and antioxidant activity. In studies conducted in accordance with systems biology principles, we evaluated the effects of this barrier on human gastric cells exposed to acidic stress. Biological functions identified via Ingenuity Pathway Analysis highlighted the product's ability to create a microenvironment that supports the mucosal structural and functional integrity, promotes healing, and restores a balanced mucosal inflammatory status. Additionally, transepithelial electrical resistance and an Ussing chamber showed the product's capability of preserving the integrity of the gastric and esophageal epithelial barriers when exposed to an acid solution. Two in vivo models of erosive gastropathy further highlighted its topical protection against ethanol- and drug-induced mucosal injury. Overall, our findings sustain the feasibility of a paradigm shift in therapeutics R&D by depicting a very innovative and desirable mode of interaction with the human body based on the emerging biophysical, rather than the pharmacological properties of these therapeutic agents.

Keywords: NeoBianacid; Poliprotect; biophysical properties; dyspepsia; emerging properties; gastroesophageal reflux disease; medical device; non-pharmacological mechanism; novel R&D paradigm.


Conflict of interest statement

S.C., C.B., S.G., I.F.M., S.U., A.G., E.P., C.S. and J.L. are employed by Bios’-Therapy, Physiological Systems For Health S.p.A. C.R., L.M. and M.P. received support from the study of the formulation described here. A.M. and A.C. are employed in the research/medical division of Aboca S.p.A. Società Agricola, the manufacturer of Poliprotect(F). S.B.d.V. has received honoraria for speaking at symposia. J.R. is a speaker bureau member for Aboca S.pA. Società Agricola. P.M. is a consultant for Aboca S.p.A. Società Agricola and a speaker bureau member for Alfasigma, Bayer, Biocodex, Menarini, and Phathom.

Figures

Figure 1
Figure 1
Bioadhesive properties of Poliprotect(F): (A) Graphical representation of the percentage of Poliprotect(F) remaining adhered on the human gastric mucus-secreting cell monolayer (NCI-N87) exposed (or not) to acid solution (pH 1) over time. SSF: simulated salivary fluid. Values are the mean ± SD; two-way ANOVA and Tukey’s post hoc test. (B) Graphical representation of the distance (mm) traveled by the device and saline solution on the surface of the plexiglass. Values are the mean ± SD of six separated experimental sessions; unpaired t-test. * p-value < 0.05; **** p-value < 0.0001.
Figure 2
Figure 2
(A) Release of cytokine IL-6 in human fibroblasts in barrier test and internal control set-up. Values are the mean ± SD; ordinary one-way ANOVA and Dunnett’s post hoc test. (B) Barrier effect against the molecule dextran–Rhodamine B. *** p-value < 0.001; **** p-value < 0.0001. ns: not significant.
Figure 3
Figure 3
Radical scavenging activity and buffering activity of Poliprotect(F): (A) Time-resolved curves of observed emitted fluorescence. The RFU measured was directly linked to the amount of ROS produced in human fibroblasts. The quantity of ROS detected in samples treated with AAPH + Poliprotect(F) was compared with that measured in the AAPH + ascorbic acid sample. Values are the mean ± SD; two-way ANOVA with Dunnett’s post hoc test. (B) Integrated areas under the curves displayed in (A) were compared in order to quantify the total amount of fluorescence emitted over time. The quantity of ROS detected in samples treated with AAPH was compared with that measured in the remaining samples. Furthermore, the quantity of ROS detected in samples treated with AAPH + Poliprotect(F) was compared with that measured in the ascorbic acid + AAPH sample. Values are the mean ± SD; one-way ANOVA and Sidak’s post hoc test were applied. For all tests, * p-value < 0.05, ** p-value < 0.01, *** p-value < 0.001, and **** p-value < 0.0001, ns: not significant. (C,D) Performance in terms of buffering barrier activity of Poliprotect(F). (E) Buffering activity of Poliprotect(F) is elicited locally on the gastric mucosa.
Figure 4
Figure 4
(A) Number of differentially expressed genes after acid-induced damage in the absence and presence of Poliprotect(F) apical treatment (experimental design in Supplementary Figure S2) in human gastric epithelial cells. The gene expression modulation is determined by a color code: blue (downregulation) and orange (upregulation). (B) Volcano plot displaying the differentially expressed genes in the same conditions described in (A). Orange dots represent significantly upregulated genes, while blue dots represent downregulated genes. Grey dots represent not significant genes. The respective gene symbols for the most significant transcripts are displayed (higher fold-change values and lower p-values). (C) Dot plot representing the differences in the modulation of canonical pathways and diseases and biofunctions between Poliprotect(F) treatment at pH 1 and physiological pH 7.4, as well as the acidic environment (pH 1) versus physiological pH (7.4) (the delta of the z-scores obtained for each comparison). The color code follows the same rule described above, and the size of the dots represents the absolute value of the differences in the z-scores.
Figure 5
Figure 5
(A) Dot plot displaying inquired biofunctions; z-scores were calculated based on the reference values of color codes provided via IPA (Supplementary Figure S4). Positive z-scores are represented in orange, while negative values are represented in blue. The size of the dots represents the absolute value of the z-score. (B) IPA network representing the genes involved in the modulation of the inquired diseases and biofunctions. The network displays the relationship for both comparisons: (i) apical acidic solution (HBSS, pH 1) versus the physiological control (pH 7.4), and (ii) previous Poliprotect(F) treatment at pH 1 versus the physiological control. Genes are colored according to the findings in the transcriptomics analysis: red represents upregulated genes, while green represents downregulated ones Diseases and biofunctions predicted to be up- and downregulated are displayed in orange and blue, respectively (Path Designer Shapes in Supplementary Figure S5). On the opposite side, orange lines represent relationships that lead to the activation of the inquired diseases and biofunctions, lines in blue represent those that lead to inhibition, yellow lines represent findings that are inconsistent with the trend of the modulation of the biofunctions obtained, and gray lines represent those in which the effect was not predicted. (C) The transepithelial electrical resistance of human gastric epithelial cells (NCI-N87) exposed to HBSS at pH 7.4 or pH 1. Values are the mean ± SD; one-way ANOVA with Dunnett’s post hoc test. ** p-value < 0.01; **** p-value < 0.0001. (D) Graphical representation of the viability of the human gastric epithelial cell monolayer, assessed by measuring the release of the enzyme adenylate kinase (AK) present in the solution where cell membrane integrity was compromised. Values are the mean ± SD; one-way ANOVA with Dunnett’s post hoc test. **** p-value < 0.0001, ns: not significant.
Figure 6
Figure 6
Preservation of the permeability of the gastric and esophageal mucosae: (A) Transepithelial electrical resistance of murine esophageal mucosae exposed to Krebs buffer at pH 7.35 or pH 3. (B) Transepithelial electrical resistance of murine gastric mucosae exposed to Krebs buffer at pH 7.35 or pH 3. For all tests, values are the mean ± SD (n = 5); unpaired t-test. **** p-value < 0.0001, ns: not significant.
Figure 7
Figure 7
Lack of direct anti-inflammatory activity in a human macrophage model (U937 model): Heatmap representation of biofunctions’ modulation observed in response to different treatment conditions. Cells treated with Poliprotect(F) and then inflamed with LPS could not be distinguished from cells inflamed with LPS alone. On the other hand, cells treated with the anti-inflammatory drug dexamethasone and then inflamed with LPS were characterized by a pattern of activation/inhibition of biofunctions similar to that of untreated (NT), non-inflamed cells.
Figure 8
Figure 8
Protective activity of Poliprotect(F) in vivo: Erosive gastropathy induced via (A) absolute ethanol and (B) indomethacin. Images of prepared morphological samples opened and extended to evaluate the presence of ulcers (indicated by black arrows) on the gastric mucosa after ethanol administration. Effects of treatments on ethanol- or indomethacin-induced gastric lesions are expressed as an ulcerogenic index. (A): SHAM (rats without lesions, treated with vehicle). (B): Ethanol or indomethacin (rats treated with ethanol or indomethacin). (C): Poliprotect(F). (D): Poliprotect(F) without (w/o) salt. (E): Poliprotect(F) without (w/o) plant material. (F): Ranitidine. Values are the mean ± s.e.m (n = 6/12). ** p-value < 0.01 versus ethanol; °° p-value < 0.01 versus Poliprotect(F); ** p-value < 0.01 versus indomethacin; ° p-value < 0.05 and °° p-value < 0.01 versus Poliprotect(F).
Figure 9
Figure 9
Schematic cartoon of the mechanism of action of Poliprotect(F).

References

    1. Blevins C.H., Iyer P.G., Vela M.F., Katzka A.D. The Esophageal Epithelial Barrier in Health and Disease. Clin. Gastroenterol. Hepatol. 2018;16:608–617. doi: 10.1016/j.cgh.2017.06.035. - DOI - PubMed
    1. Laine L., Takeuchi K., Tarnawski A. Gastric Mucosal Defense and Cytoprotection: Bench to Bedside. Gastroenterology. 2008;135:41–60. doi: 10.1053/j.gastro.2008.05.030. - DOI - PubMed
    1. Niv Y., Banić M. Gastric Barrier Function and Toxic Damage. Dig. Dis. 2014;32:235–242. doi: 10.1159/000357855. - DOI - PubMed
    1. Orlando C.R. The integrity of the esophageal mucosa. Balance between offensive and defensive mechanisms. Best Pr. Res. Clin. Gastroenterol. 2010;24:873–882. doi: 10.1016/j.bpg.2010.08.008. - DOI - PMC - PubMed
    1. Rao R. Oxidative stress-induced disruption of epithelial and endothelial tight junctions. Front. Biosci. 2008;13:7210–7226. doi: 10.2741/3223. - DOI - PMC - PubMed