. 2025 Jan 29;17(3):461.
doi: 10.3390/cancers17030461.

Role of Rac1 in p53-Related Proliferation and Drug Sensitivity in Multiple Myeloma

Affiliations

Role of Rac1 in p53-Related Proliferation and Drug Sensitivity in Multiple Myeloma

Ikuko Matsumura et al. Cancers (Basel). .

Abstract

In this work, the study presented in [...].

Keywords: Ras-related C3 botulinus toxin substrate 1 (Rac1); Rho-GTPase signaling; chemosensitivity; multiple myeloma; p53.


Conflict of interest statement

Hiroshi Handa has received honoraria from Takeda Pharmaceutical, Janssen Pharmaceutical, and Bristol–Myers Squibb. Hiroshi Handa has received research grants from Janssen Pharmaceutical, Pfizer, Amgen, GlaxoSmithKline, Sanofi, and Abbvie. Yoshiyuki Ogawa has received honoraria from Chugai Pharmaceutical. For the remaining authors, no relevant conflicts of interest were declared. The funders had no role in the design of the study; collection, analyses, or interpretation of data; writing of the manuscript; or the decision to publish the results.

Figures

Figure 1
Figure 1
Surviving cells of KMS11 were unaffected by p53 induction, but the Rho-GTPase signal was enhanced in KMS11 cells compared to that in KMS26 cells. (A) The surviving cells and protein expression of actin beta (ACTB), p53, p21 and mouse double minute 2 (Mdm2) at 24 h after treatment with 1 μg/mL of doxycycline in KMS11 expressing doxycycline-inducible p53 (KMS11/Tet-on p53) and (B) KMS26 (KMS26/Tet- on p53). Blue, no doxycycline; orange, with 1 μg/mL of doxycycline. Error bars represent the standard deviation from four experiments. (C) Gene ontology analysis revealed that genes were more highly expressed in KMS11 cells than in KMS26 cells. Original images of western blotting can be found in File S1.
Figure 1
Figure 1
Surviving cells of KMS11 were unaffected by p53 induction, but the Rho-GTPase signal was enhanced in KMS11 cells compared to that in KMS26 cells. (A) The surviving cells and protein expression of actin beta (ACTB), p53, p21 and mouse double minute 2 (Mdm2) at 24 h after treatment with 1 μg/mL of doxycycline in KMS11 expressing doxycycline-inducible p53 (KMS11/Tet-on p53) and (B) KMS26 (KMS26/Tet- on p53). Blue, no doxycycline; orange, with 1 μg/mL of doxycycline. Error bars represent the standard deviation from four experiments. (C) Gene ontology analysis revealed that genes were more highly expressed in KMS11 cells than in KMS26 cells. Original images of western blotting can be found in File S1.
Figure 2
Figure 2
RAS-related C3 botulinus toxin substrate 1 (RAC1) mRNA levels in purified bone marrow (BM) plasma cells were higher in patients with newly diagnosed MM (NDMM) than in controls. (A) RAC1 mRNA levels in purified BM plasma cells in controls and patients with monoclonal gammopathy of undetermined significance (MGUS) or NDMM. The Y axis represents the delta–delta Ct value, with actin beta (ACTB) serving as an endogenous control gene and MM.1S as the reference sample. (B) RAC1 mRNA levels in different cytogenetic abnormalities, (C) International Staging System (ISS), and (D) Revised-ISS. (E) RAC1 mRNA and (F) Rac1 expression of human myeloma cell lines based on p53 status, 24 h after treatment. KD, knockdown; NS, not significant; **, p < 0.01. Original images of western blotting can be found in File S1.
Figure 2
Figure 2
RAS-related C3 botulinus toxin substrate 1 (RAC1) mRNA levels in purified bone marrow (BM) plasma cells were higher in patients with newly diagnosed MM (NDMM) than in controls. (A) RAC1 mRNA levels in purified BM plasma cells in controls and patients with monoclonal gammopathy of undetermined significance (MGUS) or NDMM. The Y axis represents the delta–delta Ct value, with actin beta (ACTB) serving as an endogenous control gene and MM.1S as the reference sample. (B) RAC1 mRNA levels in different cytogenetic abnormalities, (C) International Staging System (ISS), and (D) Revised-ISS. (E) RAC1 mRNA and (F) Rac1 expression of human myeloma cell lines based on p53 status, 24 h after treatment. KD, knockdown; NS, not significant; **, p < 0.01. Original images of western blotting can be found in File S1.
Figure 3
Figure 3
RAS-related C3 botulinus toxin substrate 1 (Rac1) affected human myeloma cell lines (HMCLs) survival, cell cycle, and apoptosis independent of p53 status. (A) HMCL living cells at 72 h after treatment with 50 μM of Rac1 inhibitor 1A-116. White color represents the control and blue indicates the Wild Type (WT). p53 expression is higher than that in the control group. The red color indicates the control treated with 1A-116. The purple color represents the WTp53 expression, which is higher than that in the control group treated with 1A-116. (B) Protein expression of p53, p21, mouse double minute 2 (Mdm2), and actin beta (ACTB) at 24 h after treatment with 1A-116 based on p53 status. (C) 5-ethynyl-2′-deoxyuridine (EdU) positive cells of HMCLs treated with 1A-116 (50 µM). (D) HMCL cells undergoing apoptosis treated with 1A-116 (0, 25, and 50 µM). The dot plot shows results at 48 h. White, treatment with 1A-116 0 µM; pink, 25 µM; red, 50 µM. The error bars indicate the standard deviation across more than three experiments. NS, not significant; *, p < 0.05; **, p < 0.01. Original images of western blotting can be found in File S1.
Figure 3
Figure 3
RAS-related C3 botulinus toxin substrate 1 (Rac1) affected human myeloma cell lines (HMCLs) survival, cell cycle, and apoptosis independent of p53 status. (A) HMCL living cells at 72 h after treatment with 50 μM of Rac1 inhibitor 1A-116. White color represents the control and blue indicates the Wild Type (WT). p53 expression is higher than that in the control group. The red color indicates the control treated with 1A-116. The purple color represents the WTp53 expression, which is higher than that in the control group treated with 1A-116. (B) Protein expression of p53, p21, mouse double minute 2 (Mdm2), and actin beta (ACTB) at 24 h after treatment with 1A-116 based on p53 status. (C) 5-ethynyl-2′-deoxyuridine (EdU) positive cells of HMCLs treated with 1A-116 (50 µM). (D) HMCL cells undergoing apoptosis treated with 1A-116 (0, 25, and 50 µM). The dot plot shows results at 48 h. White, treatment with 1A-116 0 µM; pink, 25 µM; red, 50 µM. The error bars indicate the standard deviation across more than three experiments. NS, not significant; *, p < 0.05; **, p < 0.01. Original images of western blotting can be found in File S1.
Figure 4
Figure 4
Short hairpin RNA targeting RAS-related C3 botulinus toxin substrate 1 (ShRAC1) significantly reduced the survival of KMS11 cells. Living cells of HMCLs at eight days after virus infection and mRNA expression of RAC1, tumor protein p53 (TP53), cyclin-dependent kinase inhibitor 1A (CDKN1A), and mouse double minute 2 (MDM2) at seven days after virus infection in (A) KMS11 and (B) KMS26. Error bars show the standard deviation within the three experiments. White, Sh green fluorescent protein (GFP); red, ShRAC1; NS, not significant; *, p < 0.05; **, p < 0.01.
Figure 5
Figure 5
RAS-related C3 botulinus toxin substrate 1 (Rac1) was implicated in the sensitivity of human myeloma cell lines to cereblon modulator. We used 1A-116 at a concentration of 25 µM that did not affect KMS11 and KMS26 survival. Living cells of HMCLs, (A) KMS11 and (B) KMS26 after treatment with lenalidomide, pomalidomide, iberdomide, and bortezomib, respectively. Error bars show the standard deviation across three experiments. Blue, no Rac1 inhibitor 1A-116; orange, with 1A-116 (25 µM). NS, not significant; *, p < 0.05; **, p < 0.01.
Figure 6
Figure 6
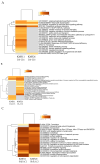
Gene ontology (GO) analysis of the gene expression profiles of human myeloma cell lines following treatment with 1A-116 or RAS-related C3 botulinus toxin substrate 1 (RAC1) knockdown. The classification is based on significantly upregulated genes by 25 μM of 1A-116 (A) and downregulated by same treatment (B) in KMS11 and KMS26. The classification is based on significantly upregulated genes by RAC1 knockdown (C) and downregulated by RAC1 knockdown (D) in KMS11 and KMS26.
Figure 6
Figure 6
Gene ontology (GO) analysis of the gene expression profiles of human myeloma cell lines following treatment with 1A-116 or RAS-related C3 botulinus toxin substrate 1 (RAC1) knockdown. The classification is based on significantly upregulated genes by 25 μM of 1A-116 (A) and downregulated by same treatment (B) in KMS11 and KMS26. The classification is based on significantly upregulated genes by RAC1 knockdown (C) and downregulated by RAC1 knockdown (D) in KMS11 and KMS26.
Figure 7
Figure 7
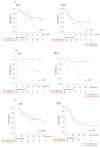
Prognosis of patients with newly diagnosed multiple myeloma (NDMM). (A) Overall survival (OS) and progression-free survival (PFS) were compared between high and low RAS-related C3 botulinus toxin substrate 1 (RAC1) gene expression of plasma cells in bone marrow (BM) in patients with NDMM. OS and PFS were analyzed separately in patients with NDMM groups with (B) and without (C) autologous stem cell transplantation. Black line, RAC1 mRNA levels of plasma cells in BM < 1.17; red line, RAC1 mRNA levels > 1.17.

References

    1. Matsumura I., Oda T., Kasamatsu T., Murakami Y., Ishihara R., Ohmori A., Gotoh N., Matsumoto A., Kobayashi N., Miyazawa Y., et al. Role of Ras-Related C3 Botulinus Toxin Substrate 1 in p53-Related Proliferation and Drug Sensitivity in Multiple Myeloma; Proceedings of the 66th American Society of Hematology Annual Meeting and Exposition; San Diego, CA, USA. 8 December 2024.
    1. Kyle R.A., Rajkumar S.V. Multiple myeloma. Blood. 2008;111:2962–2972. doi: 10.1182/blood-2007-10-078022. - DOI - PMC - PubMed
    1. Palumbo A., Anderson K. Multiple myeloma. N. Engl. J. Med. 2011;364:1046–1060. doi: 10.1056/NEJMra1011442. - DOI - PubMed
    1. Chng W.J., Dispenzieri A., Chim C.S., Fonseca R., Goldschmidt H., Lentzsch S., Munshi N., Palumbo A., Miguel J.S., Sonneveld P., et al. IMWG consensus on risk stratification in multiple myeloma. Leukemia. 2014;28:269–277. doi: 10.1038/leu.2013.247. - DOI - PubMed
    1. Kanamori T., Sanada M., Ri M., Ueno H., Nishijima D., Yasuda T., Tachita T., Narita T., Kusumoto S., Inagaki A., et al. Genomic analysis of multiple myeloma using targeted capture sequencing in the Japanese cohort. Br. J. Haematol. 2020;191:755–763. doi: 10.1111/bjh.16720. - DOI - PubMed

Grants and funding

LinkOut - more resources