

Distinctive Lipogenic Gene Expression Patterns in the Mammary Glands of Dairy Cows Are Associated with the Unique Fatty Acid Composition of Bovine Milk Fat
- PMID: 39942007
- PMCID: PMC11816880
- DOI: 10.3390/foods14030412
Distinctive Lipogenic Gene Expression Patterns in the Mammary Glands of Dairy Cows Are Associated with the Unique Fatty Acid Composition of Bovine Milk Fat
Abstract
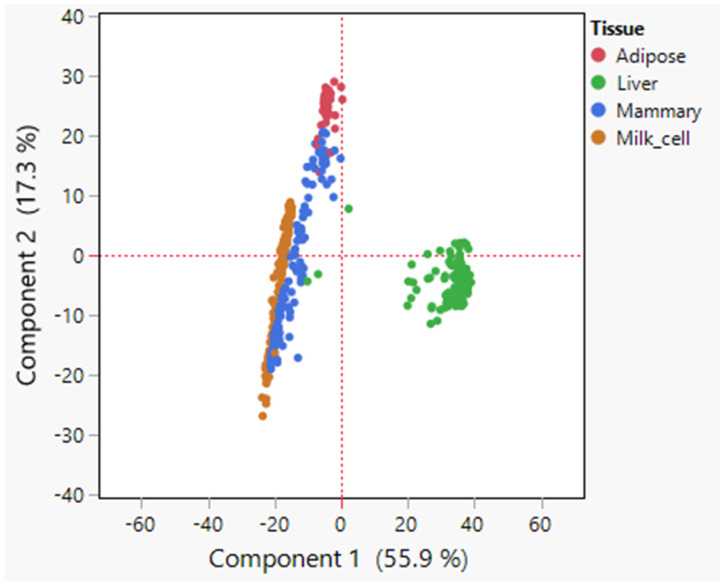
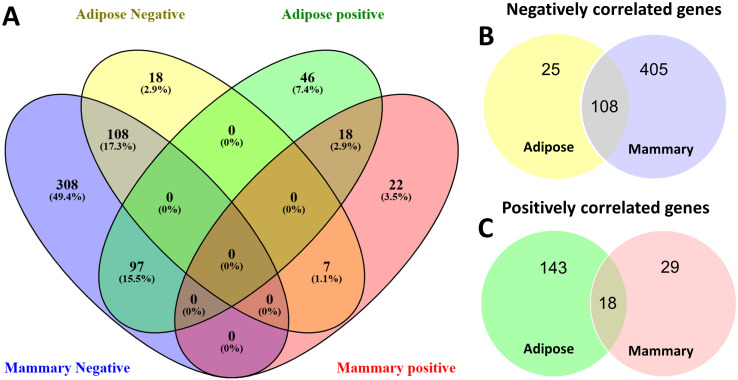
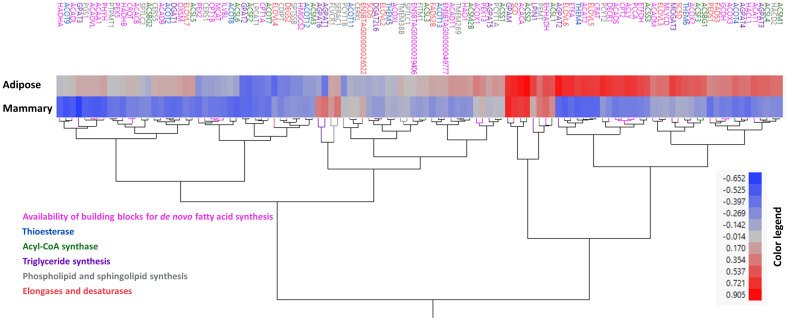
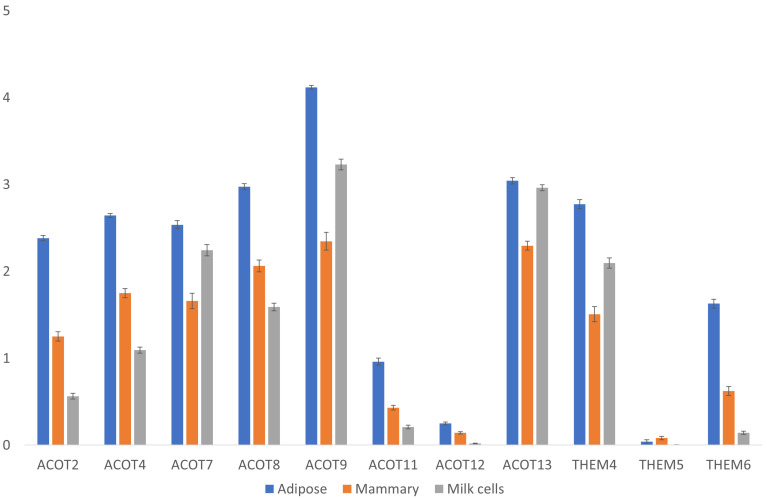
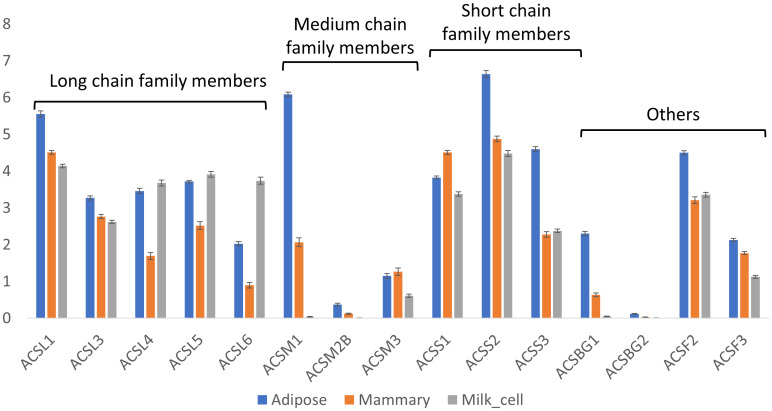
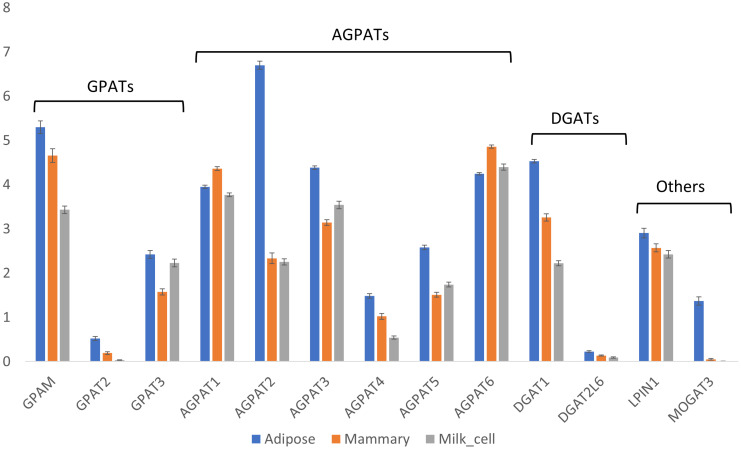
Fat composition is largely responsible for the technological and rheological properties of cow milk and dairy products. Bovine milk fat is unique in terms of its fatty acid composition and positional distribution, with about 25% of its fatty acids being short- and medium-chain, which are synthesized de novo in the mammary gland and are not present in extra-mammary tissues. With the aim to identify potential genetic factors responsible for the unique composition of bovine milk fat, we extracted genes with GO annotations related to lipid metabolism and performed a gene expression mega-analysis. Overall, different lipogenic tissues (i.e., mammary, liver, and adipose) displayed discerned expression patterns. In a PCA, the liver was significantly separated from adipose and mammary tissues. In a correlation analysis with the fatty acid synthetase (FASN) gene, notable differences among the tissues were found. In the mammary gland, the majority of genes (~70%) were negatively correlated with FASN expression, whereas only 18% were negatively correlated in adipose. Only a few genes were positively correlated with FASN exclusively in the mammary gland, including AGPAT1 and AGPAT6, which also had the highest expression in the mammary gland compared with adipose. Looking at the expression levels in tissues (TPM) revealed significant differences in the expressions of genes responsible for the activation of fatty acids by ligation to CoA, according to their carbon chain length. Notably, the ACSS1 gene, which converts acetate to acetyl-CoA, had the highest expression in the mammary gland, whereas genes responsible for the activation of long-chain fatty acids had lower expressions. The findings of the present study suggest that the unique properties of dairy fat are the results of the distinct expression patterns of genes involved in de novo synthesis of fatty acids and their downstream utilization.
Keywords: AGPATs; Acyl-CoA synthase; adipose; dairy; de novo synthesis; lipids; triglycerides.
Conflict of interest statement
The authors declare no conflicts of interest.
Figures
References
-
- Markiewicz-Kęszycka M., Czyżak-Runowska G., Lipińska P., Wójtowski J. Fatty Acid Profile of Milk-a Review. Bull. Vet. Inst. Pulawy. 2013;57:135–139. doi: 10.2478/bvip-2013-0026. - DOI
-
- MacGibbon A. Composition and Structure of Bovine Milk Lipids. In: McSweeney P.L.H., Fox P.F., O’Mahony J.A., editors. Advanced Dairy Chemistry: Lipids. Volume 2. Springer; New York, NY, USA: 2020. pp. 1–32.
-
- Bornaz S., Fanni J., Parmentier M. Limit of the Solid Fat Content Modification of Butter. J. Am. Oil Chem. Soc. 1994;71:1373–1380. doi: 10.1007/BF02541358. - DOI
-
- Arnold R., Shahani K., Dwivedi B. Application of Lipolytic Enzymes to Flavor Development in Dairy Products. J. Dairy Sci. 1975;58:1127–1143. doi: 10.3168/jds.S0022-0302(75)84692-3. - DOI
Grants and funding
LinkOut - more resources
Full Text Sources
Miscellaneous
