. 2025 Jan 22;14(3):322.
doi: 10.3390/plants14030322.

Non-Targeted Metabolome Analysis with Low-Dose Selenate-Treated Arabidopsis

Affiliations

Non-Targeted Metabolome Analysis with Low-Dose Selenate-Treated Arabidopsis

Hongqiao Li et al. Plants (Basel). .

Abstract

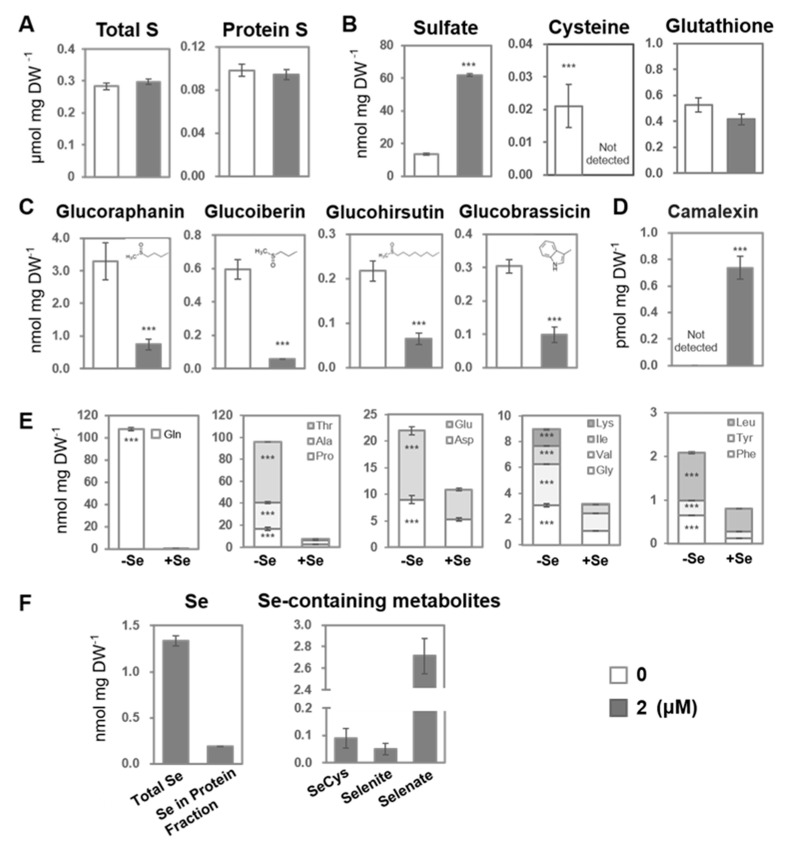
Selenate, the most common form of selenium (Se) in soil environments, is beneficial for higher plants. Selenate is similar to sulfate in terms of the structure and the manner of assimilation by plants, which involves the reduction of selenate to selenide and the replacement of an S moiety in the organic compounds such as amino acids. The nonspecific incorporation of seleno-amino acids into proteins induce Se toxicity in plants. Selenate alters the plant metabolism, particularly the S metabolism, which is comparable to the responses to S deficiency (-S). However, previous analyses involved high concentrations of selenate, and the effects of lower selenate doses have not been elucidated. In this study, we analyzed the metabolic changes induced by selenate treatment through a non-targeted metabolome analysis and found that 2 µM of selenate decreased the S assimilates and amino acids, and increased the flavonoids, while the glutathione levels were maintained. The results suggest that the decrease in amino acid levels, which is not detected under -S, along with the disruptions in S assimilation, amino acid biosynthesis pathways, and the energy metabolism, present the primary metabolic influences of selenate. These results suggest that selenate targets the energy metabolism and S assimilation first, and induces oxidative stress mitigation, represented by flavonoid accumulation, as a key adaptive response, providing a novel, possible mechanism in plant stress adaptation.

Keywords: amino acids; flavonoid; glucosinolates; non-targeted metabolome; selenate; selenium; sulfur metabolism.


Conflict of interest statement

The authors declare no conflicts of interest.

Figures

Figure 1
Figure 1
The effects of different concentrations of selenate on plant growth and low-S-inducible gene expressions. Plants were grown for 2 weeks on an agar medium supplemented with various concentrations of K2SeO4 (0, 2, 10, 20, and 50 μM). RNA was extracted from the plants exposed to 0, 2, and 10 μM of selenate and analyzed via quantitative RT-PCR. (A) Representative plant image (top). Shoot (left graph) and root (middle graph) fresh weights, and root-to-shoot ratios (right graph). Bars represent mean ± SE (n = 3). One-way ANOVA followed by the Tukey–Kramer test was performed; significant differences (p < 0.05) are indicated by distinct letters. (B) Transcript levels of BGLU28, APR3, SULTR1;1, and SULTR1;2 in the shoots and roots with different treatments. Relative mRNA levels were calculated using the ΔΔCt method, with ACT2 as an internal control. Bars represent mean ± SE (n = 3). Asterisks denote significant differences compared to the control (0 μM) (Dunnett’s test; * 0.05 ≤ p < 0.1).
Figure 2
Figure 2
Metabolomic changes caused by selenate. Plants were grown for 2 weeks on agar media supplemented with 0 or 2 μM of selenate (K2SeO4). After freeze-drying, the samples were subjected to non-targeted metabolome analysis using LCMS. Peak picking and peak annotation to a metabolite were performed as described in the Materials and Methods section. (A) PCA of the metabolites detected in the plants grown in the presence of 0 and 2 μM of selenate. (B) Metabolites significantly influenced by the 2 μM selenate treatment. We selected the metabolites with PC1 loading values of >0.5 or <−0.5 and curated them for their identities. P and N in the metabolite ID column represent positive and negative ion modes; RT, retention time (min); PC1, loading values for PC1 with the color gradient from magenta to blue representing most minus to most plus values; MSI level [18], metabolites defined by the authentic standard or the MS/MS spectra from the references [19,20,21,22,23]; Ref, reference. −Se, +Se, average of the metabolite intensities when plants were grown 0, 2 µM of selenate with the color gradient from blue to orange representing the lowest to the highest; +Se/−Se, The ratio of intensities between +Se and −Se with the color gradient from green to orange representing the lowest to the highest.
Figure 3
Figure 3
Effects of selenate on the S-, Se-, N-containing metabolite levels in Arabidopsis thaliana. Plants were grown for 2 weeks on agar media supplemented with 0 or 2 μM of selenate (K2SeO4). After freeze-drying, the samples were used for the metabolite analysis, as described in the Materials and Methods section. (A) The total S and S contents in protein fractions of the plants grown under 0 or 2 μM of selenate. (B) Sulfate, cysteine, and glutathione contents in the plants. (C) Glucosinolate contents in the plants. (D) Camalexin content in the plants. (E) Amino acid content in the plants. (F) Total Se, Se contents in the protein fractions, and selenocysteine (SeCys), selenite, and selenate contents in the plants. Bars and error bars represent the mean and standard error (n = 3), respectively. Asterisks indicate significant differences between the two conditions, as determined by Student’s t-test (*** p < 0.01).
Figure 4
Figure 4
Changes in the metabolite profiles in plants induced by the selenate treatment. Metabolites exhibiting significantly increased and decreased levels are indicated by orange boxes and green boxes, respectively, and the fold changes are indicated by the color gradient, as shown with the boxes on the bottom. Metabolites that were not changed or detected are indicated by open boxes or no background, respectively. Asp and Glu were categorized in the no-change group, as their increase and decrease were not identical between the LCMS and HPLC analyses (Figure 2B and Figure 3E; Tables S1 and S2). Continuous arrows represent one-step reactions and dashed arrows indicate a series of biochemical reactions.

References

    1. Pilon-Smits E.A.H., Quinn C.F., Tapken W., Malagoli M., Schiavon M. Physiological functions of beneficial elements. Curr. Opin. Plant Biol. 2009;12:267–274. doi: 10.1016/j.pbi.2009.04.009. - DOI - PubMed
    1. White P.J., Brown P.H. Plant nutrition for sustainable development and global health. Ann. Bot. 2010;105:1073–1080. doi: 10.1093/aob/mcq085. - DOI - PMC - PubMed
    1. Zhu Y.-G., Pilon-Smits E.A.H., Zhao F.-J., Williams P.N., Meharg A.A. Selenium in higher plants: Understanding mechanisms for biofortification and phytoremediation. Trends Plant Sci. 2009;14:436–442. doi: 10.1016/j.tplants.2009.06.006. - DOI - PubMed
    1. Gupta M., Gupta S. An overview of selenium uptake, metabolism, and toxicity in plants. Front. Plant Sci. 2017;8:2074. doi: 10.3389/fpls.2016.02074. - DOI - PMC - PubMed
    1. Zhou X., Yang J., Kronzucker H.J., Shi W. Selenium biofortification and interaction with other elements in plants: A review. Front. Plant Sci. 2020;11:586421. doi: 10.3389/fpls.2020.586421. - DOI - PMC - PubMed

LinkOut - more resources