. 2025 Jan 31;25(3):869.
doi: 10.3390/s25030869.

Does Scanner Choice Matter for the Design of Foot Orthosis?

Affiliations

Does Scanner Choice Matter for the Design of Foot Orthosis?

Komal Chhikara et al. Sensors (Basel). .

Abstract

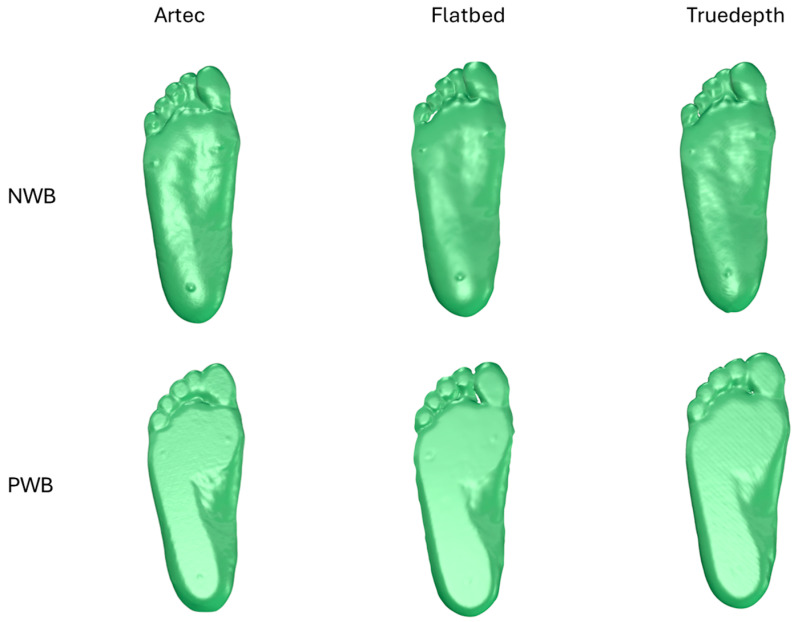
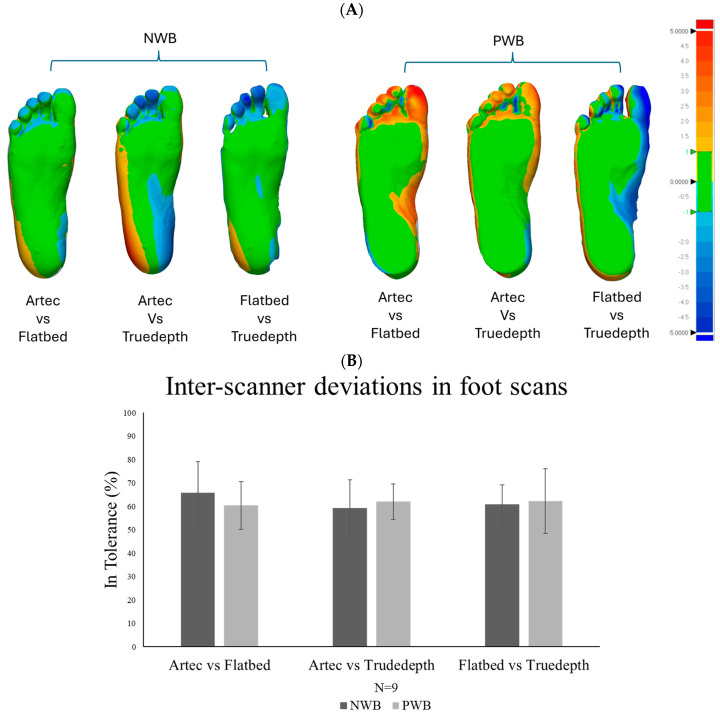
A variety of 3D volumetric scanners and smart-device applications are currently being used in podiatry for recording virtual foot data. The accuracy and reliability of these devices vary, resulting in a large variation in the quality of foot scans used for orthotic design. While it is widely believed that a higher quality scanner yields a better scan and thus is expected to produce a more accurate orthotic design, the direct impact of scanning quality on orthotic design has not yet been tested. Therefore, in this study, three commonly used industrial 3D scanners with varying output qualities were used to obtain foot scans of three participants in two weight-bearing conditions. A total of 54 foot scans were obtained, out of which 18 were used to design orthotic insoles using commercial software (FitFoot360). We found variation in the quality of foot scans produced by the different scanners (61.75 ± 2.23% similarity of the foot scans showing a deviation of less than ±1 mm). However, there were no significant differences in the designed foot orthoses within the same weight-bearing condition (83.59 ± 1.97% similarity of the orthotic designs showing a deviation of less than ±1 mm). The medial arch height and heel width differed significantly only when the weight-bearing condition was changed. The findings from this study suggest that the industrial design and production of an orthotic insole using current methods does not depend on the scanning quality of the scanner used but is dependent on the extent of weight bearing.

Keywords: foot; geometry; orthoses; orthotic design; scanning; three-dimensional.


Conflict of interest statement

Dean Hartley and Kerrie Evans are employees of Healthia Limited and Scott Morrison is an employee of iOrthotics from within which this study took place. However, their affiliation with Healthia Limited and iOrthotics did not influence the study design, data collection and analysis, decision to publish, or manuscript preparation. The remaining authors contributed independently to this work, ensuring unbiased data interpretation and conclusions, hence declare no conflicts of interest.

Figures

Figure 1
Figure 1
Flowchart for the methodological process.
Figure 2
Figure 2
(A) PWB: the picture on the left shows the scanning position with Perspex glass and the picture on the right shows the PWB position on the laser flatbed scanner; (B) the NWB position for scanning (3D stickers being placed on anatomical landmarks).
Figure 3
Figure 3
(A) Developed RG workflow. (B) Measurements taken in the plantar region: (1) foot length, (2) forefoot width, (3) heel width, (4) base to first MT head (5) base to fifth MT head, (6) heel to MT1, (7) MT1 to MT5, and (8) MT5 to heel.
Figure 4
Figure 4
Picture of foot scans obtained from each scanner.
Figure 5
Figure 5
ANOVA and post hoc Student–Newman–Keuls (SNK) tests for (A) NWB and (B) PWB measurement comparison (N = 9). No significant differences were found.
Figure 6
Figure 6
(A) Scanner reliability analysis for NWB and PWB foot scans (N = 9) (mean of scan measurements: 1 vs. 2, 2 vs. 3, and 3 vs. 1). Green region indicates acceptable deviation, also referred to as “in tolerance” in which the orthotic designs conform within a range of ±1 mm. The red colour indicates all the positive values exceeding +1 mm and the blue region indicates all the negative values beyond −1 mm. (B) % similarity in foot scans obtained from the same scanner.
Figure 7
Figure 7
(A) Scanner accuracy analysis for NWB and PWB foot scans (N = 9). The green region indicates acceptable deviation, also referred to as “in tolerance” in which the orthotic designs conform within a range of ±1 mm. The red colour indicates all the positive values exceeding +1 mm and the blue region indicates all the negative values beyond −1 mm. (B) % similarity in foot scans obtained from different scanners.
Figure 8
Figure 8
NWB vs. PWB foot scan analysis. The green region indicates acceptable deviation, also referred to as “in tolerance” in which the orthotic designs conform within a range of ±1 mm. The red colour indicates all the positive values exceeding +1 mm and the blue region indicates all the negative values beyond −1 mm.
Figure 9
Figure 9
Orthotic design analysis for (A) NWB and PWB and (B) NWB vs. PWB orthotic designs (N = 3). The green region indicates acceptable deviation, also referred to as “in tolerance” in which the orthotic designs conform within a range of ±1 mm. The red colour indicates all the positive values exceeding +1 mm and the blue region indicates all the negative values beyond −1 mm. (C) % similarity in orthotic designs created for foot scans obtained from different scanners in NWB and PWB conditions.
Figure 9
Figure 9
Orthotic design analysis for (A) NWB and PWB and (B) NWB vs. PWB orthotic designs (N = 3). The green region indicates acceptable deviation, also referred to as “in tolerance” in which the orthotic designs conform within a range of ±1 mm. The red colour indicates all the positive values exceeding +1 mm and the blue region indicates all the negative values beyond −1 mm. (C) % similarity in orthotic designs created for foot scans obtained from different scanners in NWB and PWB conditions.

References

    1. Razeghi M., Batt M.E. Biomechanical analysis of the effect of orthotic shoe inserts: A review of the literature. Sports Med. 2000;29:425–438. doi: 10.2165/00007256-200029060-00005. - DOI - PubMed
    1. Mojica M.N. Atlas of Orthoses and Assistive Devices. Elsevier; Amsterdam, The Netherlands: 2019. Foot Orthoses; pp. 233–238.e1. - DOI
    1. Collins N., Bisset L., McPoil T., Vicenzino B. Foot orthoses in lower limb overuse conditions: A systematic review and meta-analysis. Foot Ankle Int. 2007;28:396–412. doi: 10.3113/FAI.2007.0396. - DOI - PubMed
    1. Landorf K.B., Keenan A.M., Herbert R.D. Effectiveness of different types of foot orthoses for the treatment of plantar fasciitis. J. Am. Podiatr. Med. Assoc. 2004;94:542–549. doi: 10.7547/0940542. - DOI - PubMed
    1. Anggoro P.W., Tauviqirrahman M., Jamari J., Bayuseno A.P., Bawono B., Avelina M.M. Computer-aided reverse engineering system in the design and production of orthotic insole shoes for patients with diabetes. Cogent. Eng. 2018;5:1470916. doi: 10.1080/23311916.2018.1470916. - DOI

LinkOut - more resources