. 2025 Mar 5;42(3):msaf042.
doi: 10.1093/molbev/msaf042.

Lineage-Specific Class-A GPCR Dynamics Reflect Diverse Chemosensory Adaptations in Lophotrochozoa

Affiliations

Lineage-Specific Class-A GPCR Dynamics Reflect Diverse Chemosensory Adaptations in Lophotrochozoa

Rohan Nath et al. Mol Biol Evol. .

Abstract

Sensing external chemosensory cues via Class-A G protein-coupled receptors (GPCRs) is crucial for a multitude of behavioral and biological functions, influencing animal evolution and ecological adaptations. While extensively studied in vertebrates and echinoderms, the role of GPCR-mediated chemoreception in major protostome clades like Lophotrochozoa remains obscure despite their remarkable ecological adaptations across diverse aquatic and terrestrial environments. Utilizing 238 lophotrochozoan genomes across eight phyla, we conducted a large-scale comparative genomics analysis to identify lineage-specific expansions of Class-A GPCR subsets that are likely adapted for chemoreception. Using phylogeny and orthology-inference-based clustering, we distinguished these expansions from conserved orthogroups of prospective endogenous ligand-binding Class-A GPCR subsets. Across phyla, lineage-specific expansions correlated with adaptations to various habitats, ecological niches, and lifestyles, while the influence of whole-genome duplications in driving these lineage-specific expansions appeared to be less significant. Species adapted to various coastal, freshwater, and terrestrial habitats across several classes of Mollusca, Annelida, and other analyzed phyla exhibit large and diverse lineage-specific expansions, while adaptations to extreme deep-sea environments, parasitic lifestyles, sessile behaviors, or alternative chemosensory mechanisms consistently exhibit reductions. Sequence heterogeneity, signatures of positive selection, and conformational flexibility in ligand-binding pockets further highlighted adaptations to environmental signals. In summary, the evolutionary dynamics of Class-A GPCRs in lophotrochozoans reveal a widespread pattern of lineage-specific expansions driven by adaptations for chemoreception across diverse environmental niches, mirroring the trends and prominent roles seen in deuterostome lineages. The comprehensive datasets spanning numerous genomes offer a valuable foundation for advancing GPCR-mediated chemoreception studies in Lophotrochozoa.

Keywords: Class-A GPCRs; Lophotrochozoa; chemoreception; environmental adaptations; genome evolution; lineage-specific expansions.


Conflict of interest statement

Conflict of Interest: The authors declare that they have no competing interests.

Figures

Fig. 1.
Fig. 1.
Overview of the LSE identification protocol and summary of Class-A GPCR LSEs in Lophotrochozoa. a) Schematic illustration of the methodological workflow used for the systematic identification of Class-A GPCR LSEs across each analyzed species. b) Summary of the representative list of analyzed taxa, their taxonomic classifications, and gene counts. The heatmap on the right depicts expansions and contractions of total Class-A GPCR counts, including one-to-one orthologs and LSE subsets. Identified LSEs are categorized into full-length, truncated, and pseudogene counts, with the color scale for each heatmap column displayed at the top. The classification of taxa into their respective groups is based on NCBI taxonomy records, and this approach is consistently applied across all figures.
Fig. 2.
Fig. 2.
Significant variations in Class-A GPCR repertoire and LSE counts across groups. Raincloud plots show statistically significant differences in both overall and pairwise comparisons across the analyzed groups for Class-A GPCR counts a) and LSE subsets b). Statistical significance was assessed using the Kruskal–Wallis rank sum test, followed by Dunn's post hoc analysis with Bonferroni correction. Only significant differences (P < 0.05) are reported. Other molluskan classes include Solenogastres, Polyplacophora, Monoplacophora, and Scaphopoda, while additional lophotrochozoan phyla include Entoprocta, Bryozoa, Phoronida, Brachiopoda, and Nemertea. The data corresponding to the statistical plots are available in supplementary table S2, Supplementary Material online and Zenodo repository.
Fig. 3.
Fig. 3.
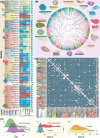
Comparative genomics and phylogenetic analysis of LSEs in Gastropoda. a) Representation of gastropods, showing taxonomic classifications, gene counts, and LSE classifications (full-length, truncated, pseudogene). Habitat distribution is represented as M (marine), F (freshwater), T (terrestrial), and DH (deep-sea hydrothermal vents). Colored dots indicate BUSCO genome completeness scores. The color scale for each column is displayed at the bottom. b) Maximum-likelihood (ML) tree displaying lineage-specific clustering of Class-A GPCRs from representative taxa across analyzed orders, with high-confidence supports (red circles, bootstrap values > 90%). The genomic organization of these LSEs, highlighting their tandem arrangements within genomic scaffolds, is shown in supplementary fig. S3, Supplementary Material online. c) Heatmap illustrates the absence of one-to-one orthologs between species in the OrthoFinder analysis. Phylogenetically classified LSEs were used as inputs for OrthoFinder cross-validation, with the number of sequences from each taxon displayed on the right. Cells with zero one-to-one orthologs are highlighted in teal. One-to-one orthologs are primarily found in intra-genus comparisons (red squares). Few orthologs were observed outside these comparisons in the OrthoFinder analysis, but they align within LSE-forming clusters in phylogenetic trees (see Supplementary material). Panel d) presents statistical analyses. Significant differences in LSE counts: (i) between Conus and Pomacea genera compared to other lophotrochozoan species (W = 931) (left); (ii) between gastropods in deep-sea hydrothermal vents and marine environments (t = −3.19; df = 6) (center); (iii) between members of the Patellogastropoda order and other gastropods (W = 6) (right). The Wilcoxon rank sum exact test was used for (i) and (iii), and the two-sample t-test for (ii), with P < 0.05 considered significant. The data corresponding to the statistical plots are available in supplementary table S2, Supplementary Material online and Zenodo repository.
Fig. 4.
Fig. 4.
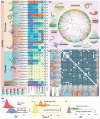
Phyletic distribution and comparative genomic analysis of LSEs in Bivalvia. a) Representation of bivalves, detailing taxonomic classifications, gene counts, and LSE classifications (full-length, truncated, pseudogene). Habitat distribution: M (marine), F (freshwater), T (terrestrial), DS (deep-sea), and DH (deep-sea hydrothermal vents). Colored dots indicate BUSCO genome completeness scores. The color scale for each column is displayed at the bottom. b) ML tree displaying LSEs from representative taxa across analyzed bivalve orders, with high-confidence supports (red circles, bootstrap values > 90%). The genomic organization of these LSEs, highlighting their tandem arrangements within genomic scaffolds, is shown in supplementary fig. S3, Supplementary Material online. c) Heatmap illustrating the absence of one-to-one orthologs between species for classified LSEs using OrthoFinder analysis. Phylogenetically classified LSEs were used as inputs for OrthoFinder cross-validation, with the number of sequences from each taxon displayed on the right. Cells with zero one-to-one orthologs are highlighted in teal. One-to-one orthologs are primarily found in intra-genus comparisons (red squares). The color scheme and the description of the OrthoFinder plot are consistent with Fig. 3. Panel d) presents statistical analyses: (i) significant variations in LSE counts among Venerida, Myida, and Ostreida compared to other bivalves (W = 550) (left); (ii) significant differences in Class-A GPCR counts between Unionida freshwater mussels and other marine bivalves (center); (iii) no significant difference in Class-A GPCRs between bivalves and gastropods (W = 1326.5) (right). Wilcoxon rank sum tests with continuity correction were applied for (i) and (iii), while (ii) utilized Kruskal–Wallis rank sum tests, followed by Dunn's post hoc analysis with Bonferroni correction. Differences with P < 0.05 were considered statistically significant. The data corresponding to the statistical plots are available in supplementary table S2, Supplementary Material online and Zenodo repository.
Fig. 5.
Fig. 5.
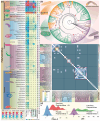
Distribution and observed dynamics of LSEs in cephalopods and other molluskan classes. a) Representation of analyzed cephalopods, including taxonomic classifications, gene counts, and categorization of LSEs (full-length, truncated, pseudogene). Habitat distribution: M (marine) and DS (deep-sea). Colored dots indicate BUSCO genome completeness scores. The color scale for each column is displayed at the bottom. b) ML tree displaying LSEs from representative cephalopod taxa with high-confidence support (bootstrap values > 90% indicated by red circles). The genomic organization of these LSEs, highlighting their tandem arrangements within genomic scaffolds, is shown in supplementary fig. S4, Supplementary Material online. c) Heatmap illustrating the absence of one-to-one orthologs between species for classified LSEs using OrthoFinder analysis. The color scheme and description of the plot are consistent with Figs. 3 and 4. Panels d) to f) depict comparative analysis and observed patterns in other molluskan classes. d) Phylogenetic distribution showing gene counts and classifications for other molluskan classes. Habitat distributions: M for marine, DS for deep-sea. e) ML tree topology displaying LSE clustering. The genomic organization of these LSEs, highlighting their tandem arrangements within genomic scaffolds, is shown in supplementary fig. S4, Supplementary Material online. f) Heatmap illustrating the absence of one-to-one orthologs between species for classified LSEs using OrthoFinder analysis. Panel g) shows statistical analyses: significant differences in LSEs (W = 92) and Class-A GPCRs (W = 0) between cephalopods and combined gastropods/bivalves (i and ii); (iii) significant differences in LSE counts between deep-sea and marine cephalopod species (W = 51). Wilcoxon rank sum test with continuity correction was used for all three plots; differences with P < 0.05 were considered significant. The data corresponding to the statistical plots are available in supplementary table S2, Supplementary Material online and Zenodo repository.
Fig. 6.
Fig. 6.
Comparative analysis and evolutionary dynamics of LSEs in Annelida. a) Representation of analyzed annelids, detailing taxonomic classifications, gene counts, and LSE classifications (full-length, truncated, pseudogene). Habitat distribution: M (marine), T (terrestrial), DS (deep-sea), and DH (deep-sea hydrothermal vents). Lifestyle: P (parasitic). Colored dots indicate BUSCO genome completeness scores. The color scale for each column is displayed at the bottom. b) ML tree displaying LSEs from representative annelids with high-confidence support (bootstrap values > 90% indicated by red circles). The genomic organization of these LSEs, highlighting their tandem arrangements within genomic scaffolds, is shown in supplementary fig. S4, Supplementary Material online. c) Heatmap illustrates the absence of one-to-one orthologs between species for phylogenetically classified LSEs using OrthoFinder analysis. The color scheme and description of the plot are consistent with Figs. 3 to 5. Panel d) presents statistical analyses: (i) significant differences in LSEs between class Polychaeta and Sipunculus and the rest of the Annelida classes (W = 23.5); (ii and iii) between parasitic freshwater leeches of the order Hirudinida and Rhynchobdellida and rest of the Annelida species in both Class-A GPCRs (t = −4.07, df = 26.08) and LSE (W = 0), respectively. Wilcoxon rank sum test with continuity correction was used for (i) and (iii), and a Welch two-sample t-test for equal variances for (ii), with P < 0.05 considered significant. The data corresponding to the statistical plots are available in supplementary table S2, Supplementary Material online and Zenodo repository.
Fig. 7.
Fig. 7.
Comparative genomic analysis informs contrasting patterns between free-living and parasitic Platyhelminthes. a) Representation of analyzed Platyhelminthes, detailing taxonomic classifications, gene counts, and LSE categorizations (full-length, truncated, pseudogene). Habitat distribution: F (freshwater), M (marine). Lifestyle: P (parasitic). Colored dots indicate BUSCO genome completeness scores. The color scale for each column is displayed at the bottom. b) ML tree displaying LSEs from representative Platyhelminthes with high-confidence support (bootstrap values > 90% indicated by red circles). The genomic organization of these LSEs, highlighting their tandem arrangements within genomic scaffolds, is shown in supplementary fig. S4, Supplementary Material online. c) Heatmap illustrates the absence of one-to-one orthologs between species for classified LSEs using OrthoFinder inference. The color scheme and description of the plot are consistent with Figs. 3 to 6. d) Statistical analysis shows significant differences in (i) Class-A GPCR counts (W = 364) and (ii) LSE counts (W = 364) between parasitic and free-living Platyhelminthes. The Wilcoxon rank sum test with continuity correction was used, with P < 0.05 considered significant. The data corresponding to the statistical plots are available in supplementary table S2, Supplementary Material online and Zenodo repository.
Fig. 8.
Fig. 8.
Phyletic distribution and overall trends in other lophotrochozoan phyla. a) Representation of other analyzed lophotrochozoan phyla, detailing taxonomic classifications, gene counts, and LSE classifications (full-length, truncated, pseudogene). Habitat distribution: F (freshwater), M (marine). Colored dots indicate BUSCO genome completeness scores. The color scale for each column is displayed at the bottom. b) ML tree displaying LSEs from representative species with high-confidence support (bootstrap values > 90% indicated by red circles). The genomic organization of these LSEs, highlighting their tandem arrangements within genomic scaffolds, is shown in supplementary fig. S4, Supplementary Material online. c) Heatmap illustrates the absence of one-to-one orthologs between species for classified LSEs using OrthoFinder inference. The color scheme and description of the plot are consistent with Figs. 3 to 7.
Fig. 9.
Fig. 9.
Ks distribution plots depicting gene duplications in representative lophotrochozoan genomes. Each histogram shows the number of duplicate genes against synonymous substitution rates (Ks), with gray bars representing all duplicated genes and green bars representing anchor genes (anchor genes are duplicated genes located within duplicated collinear blocks in the genome). Genomes without WGD typically exhibit a rapid decline in duplicate numbers as Ks increases or display dispersed anchor genes without a distinct peak, as seen in most taxa (e.g. Macrostomum lignano and Harmothoe impar). In Arion vulgaris, a broad, low peak between Ks = 2 to 4 suggests a very low probability of ancient WGD. Overall, the analysis clearly indicates that these genomes lack any evidence for WGD events.
Fig. 10.
Fig. 10.
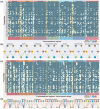
Multiple alignments illustrate the rate of evolution and signatures of positive selection in ligand-binding pockets of LSEs across phyla. Each sequence in the alignment is a consensus derived from the largest LSE cluster of representative taxa. The background displays the entropy value of each consensus amino acid position from the corresponding LSE alignment, with varying shades of gray. Amino acids involved in inter-TM contacts are highlighted in yellow, and those interacting with the extracellular loop(s) are highlighted in red. Below each TM segment, a bar plot shows the overall entropy for the corresponding alignment position, with yellow to red indicating absolute entropy and light blue to dark blue indicating amino acid property-based entropy. The alignment's topology is illustrated above, highlighting the extracellular ligand-binding regions of the alignment in red. High entropy regions at the ligand-binding interface are boxed in red in the alignment. The left panel shows side and top views of a 3D Class-A GPCR model highlighting the ligand-binding pockets.
Fig. 11.
Fig. 11.
Diversity of residue contact networks within and across different phyla. a) Inter-TM residue contact network analysis is shown as a heatmap quantifying residue pairs based on amino acid properties (OH, hydroxyl; AL, aliphatic; AR, aromatic; SU, sulfur-group containing; S, small-sized; BA, basic; AC, acidic; AM, amide-group containing) across different phyla. The heatmap color scale is on the right, with cells showing zero residue pairs highlighted in teal. b) Schematic representations of inter-TM contacts in different groups, with each TM represented as circles and lines indicating cumulative contacts. The line width is proportional to the number of contacts. c) TM-ECL residue contact network analysis is illustrated as a heatmap quantifying residue pairs categorized by amino acid properties (as in panel a) across various phyla. The color scheme of the heatmap is the same as panel a). d) Schematic representations of the TM-ECL contact network, with circles for TM and rectangles for ECL. Lines between a circle and a rectangle indicate cumulative contacts across different phyla. The line width corresponds to the number of contacts.

References

    1. Allard CA, Valencia-Montoya WA, Bellono NW. Cephalopod chemotactile sensation. Curr Biol. 2023a:33(20):R1081–R1082. 10.1016/j.cub.2023.08.011. - DOI - PMC - PubMed
    1. Allard CAH, Kang G, Kim JJ, Valencia-Montoya WA, Hibbs RE, Bellono NW. Structural basis of sensory receptor evolution in octopus. Nature. 2023b:616(7956):373–377. 10.1038/s41586-023-05822-1. - DOI - PMC - PubMed
    1. Altschul SF, Madden TL, Schäffer AA, Zhang J, Zhang Z, Miller W, Lipman DJ. Gapped BLAST and PSI-BLAST: a new generation of protein database search programs. Nucleic Acids Res. 1997:25(17):3389–3402. 10.1093/nar/25.17.3389. - DOI - PMC - PubMed
    1. Andouche A, Valera S, Baratte S. Exploration of chemosensory ionotropic receptors in cephalopods: the IR25 gene is expressed in the olfactory organs, suckers, and fins of Sepia officinalis. Chem Senses. 2021:46:bjab047. 10.1093/chemse/bjab047. - DOI - PubMed
    1. Bachmanov AA, Bosak NP, Lin C, Matsumoto I, Ohmoto M, Reed DR, Nelson TM. Genetics of taste receptors. Curr Pharm Des. 2014:20(16):2669–2683. 10.2174/13816128113199990566. - DOI - PMC - PubMed

Substances

LinkOut - more resources