. 2025 Jan 29:15:1504114.
doi: 10.3389/fgene.2024.1504114. eCollection 2024.

Based on bioinformatics, SESN2 negatively regulates ferroptosis induced by ischemia reperfusion via the System Xc-/GPX4 pathway

Affiliations

Based on bioinformatics, SESN2 negatively regulates ferroptosis induced by ischemia reperfusion via the System Xc-/GPX4 pathway

Jiejie Hu et al. Front Genet. .

Abstract

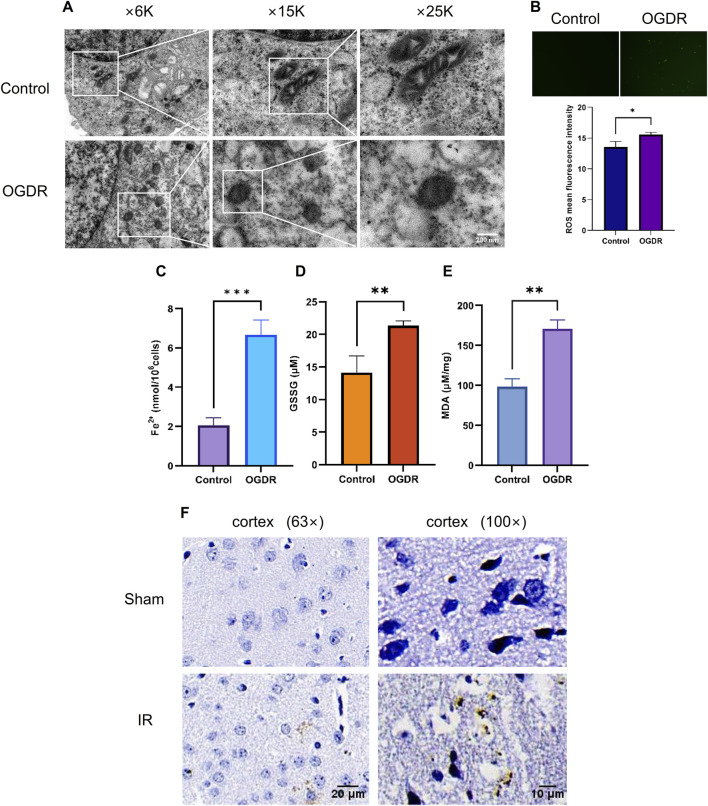
Introduction: Cerebral ischemia-reperfusion (IR) causes severe secondary brain injury. Previous studies have demonstrated that ferroptosis is involved in IR-induced brain injury. However, whether IR induces ferroptosis in brain microvascular endothelial cells (BMVECs) is not fully understood.

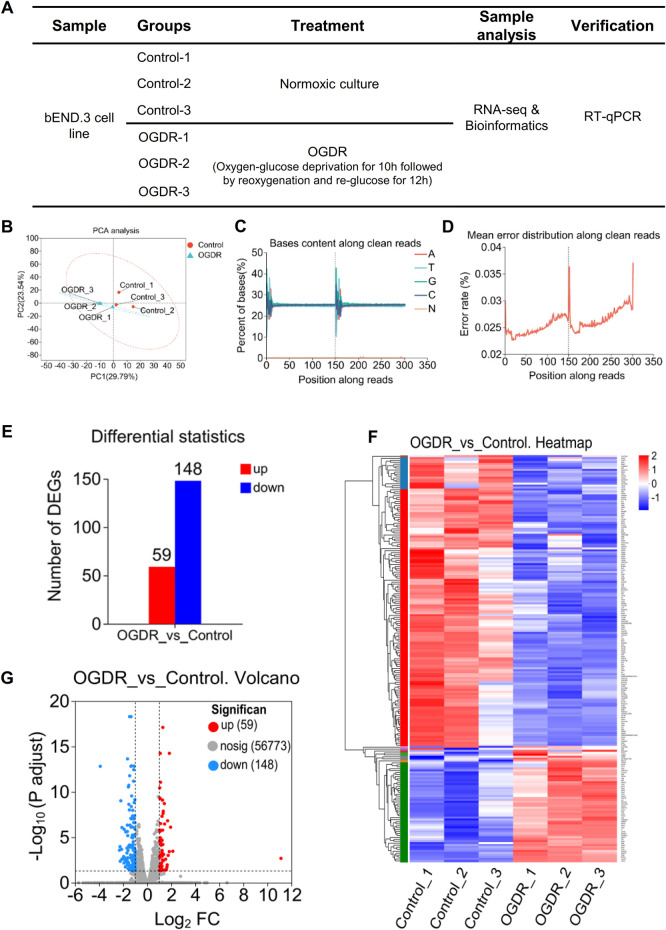
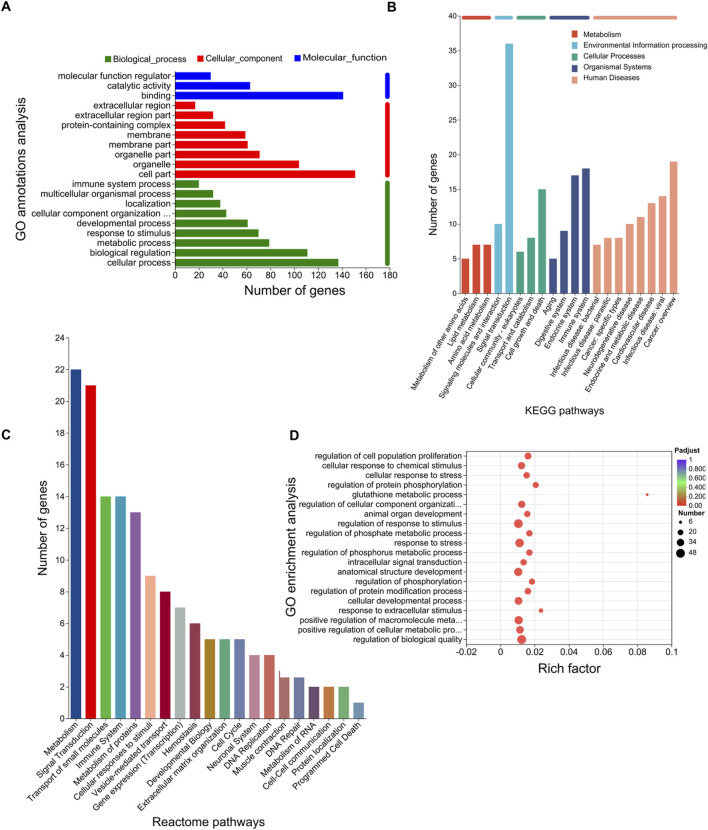
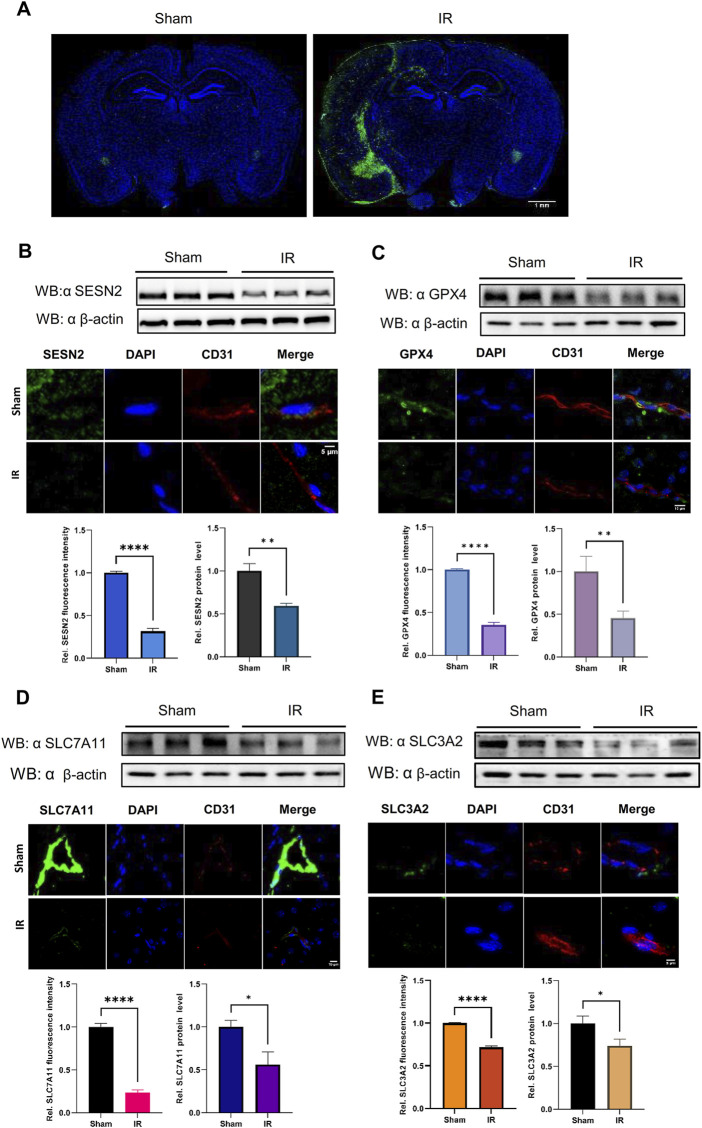
Materials and methods: Oxygen-glucose deprivation/reoxygenation (OGDR) was performed in bEND.3 cells to mimic IR injury in vitro, and a focal cerebral IR model was created in C57BL/6 mice. Transcriptomic sequencing of the cells was performed first, followed by bioinformatics analysis. Differentially expressed gene (DEG) enrichment analysis highlighted ferroptosis-related pathways.

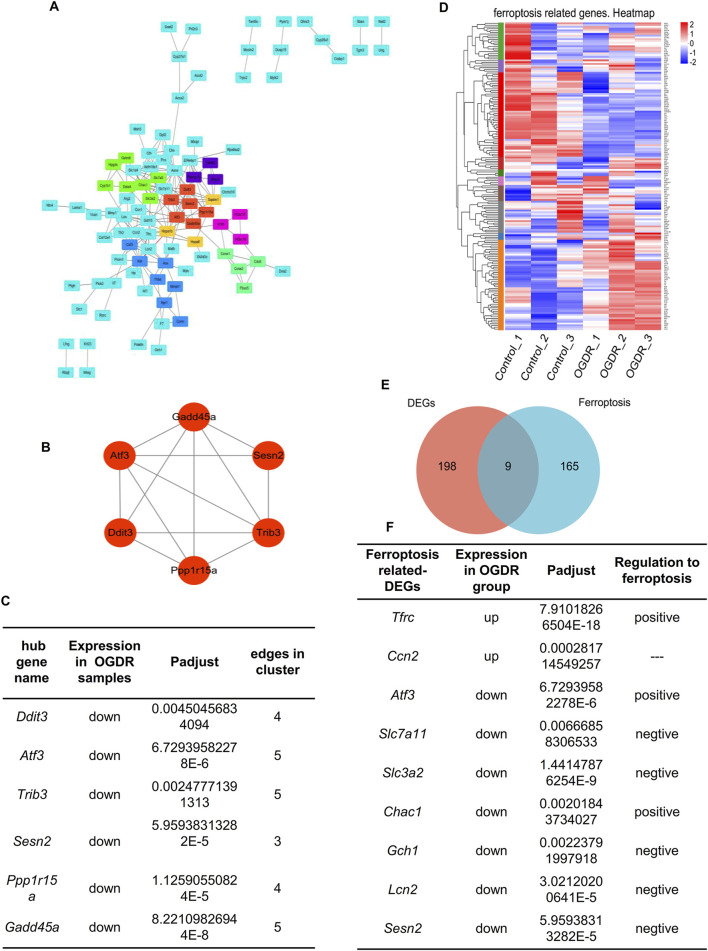
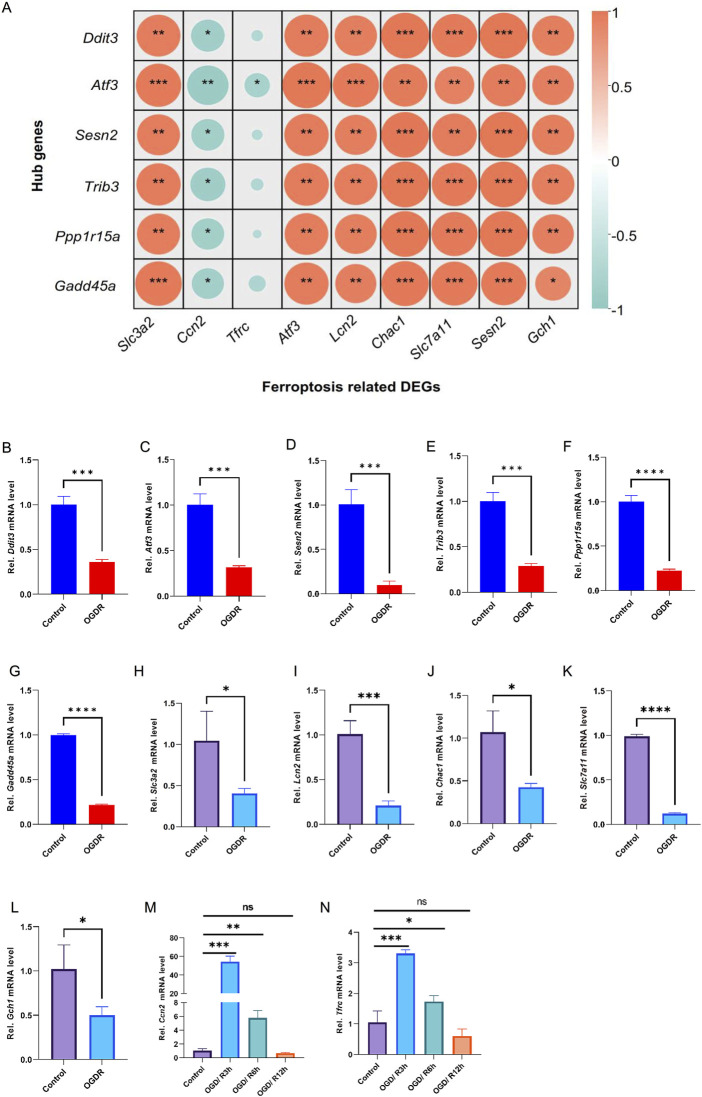
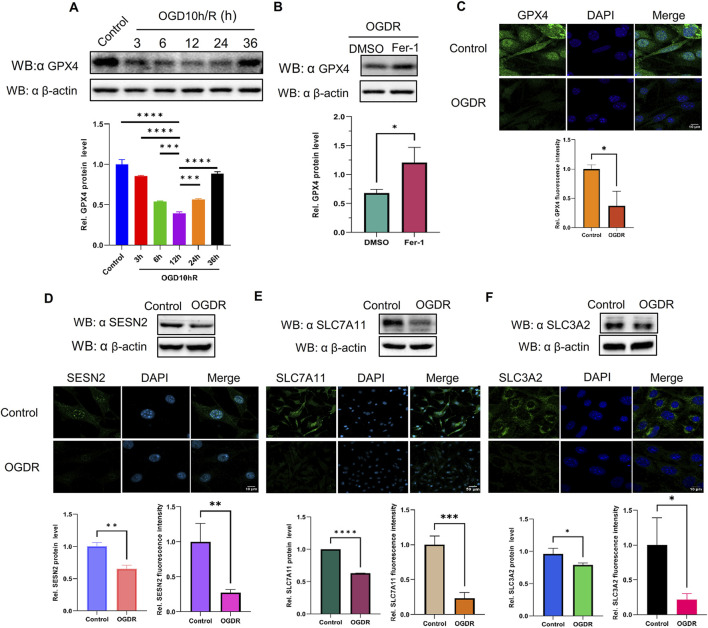
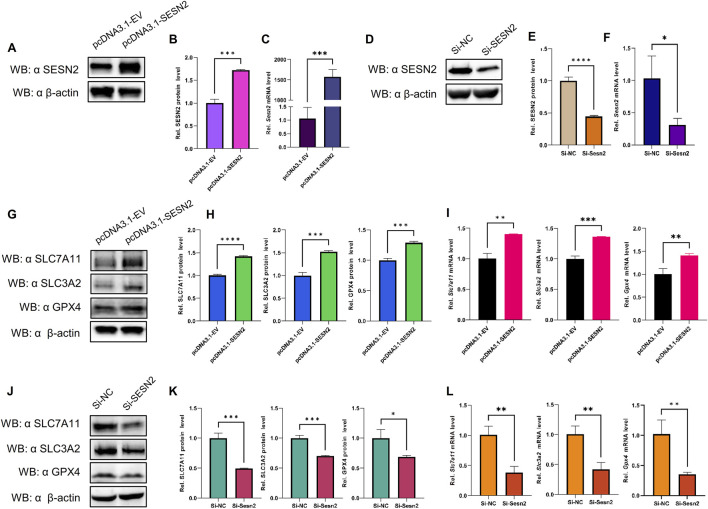
Results: Using Venn analysis, nine ferroptosis-related DEGs were identified, namely, Slc3a2, Slc7a11, Ccn2, Tfrc, Atf3, Chac1, Gch1, Lcn2, and Sesn2. Protein-protein interaction (PPI) analysis combined with molecular complex detection (MCODE) identified six hub genes, namely, Ddit3, Atf3, Sesn2, Trib3, Ppp1r15a, and Gadd45a. Spearman's correlation analysis revealed a significant correlation between the hub genes and ferroptosis-related DEGs. After reperfusion, the levels of ferroptosis indicators were elevated, and the expression of the ferroptosis-related proteins Xc- and GPX4 decreased. SESN2 is a hub gene and key antioxidant regulator. SESN2 silencing reduced the expression of System Xc- and GPX4, whereas overexpression of SESN2 promoted the expression of System Xc- and GPX4.

Discussion: These results suggest that SESN2 is a negative regulator of ferroptosis. Enhancing the expression of SESN2 can alleviate ferroptosis through the activation of the System Xc-/GPX4 pathway. By integrating bioinformatics analysis with mechanistic exploration, this study revealed that ferroptosis plays a crucial role in IR-induced BMVECs injury, with SESN2 acting as a negative regulator via the System Xc-/GPX4 pathway.

Keywords: RNA-seq; SESN2; brain microvascular endothelial cells; ferroptosis; hub gene; ischemia/reperfusion; system Xc-.


Conflict of interest statement

The authors declare that the research was conducted in the absence of any commercial or financial relationships that could be construed as a potential conflict of interest.

Figures

FIGURE 1
FIGURE 1
RNA-seq and obtaining DEGs. (A) Sample design diagram for RNA-seq. (B–D) Visualization of RNA-seq data quality control: PCA analysis between samples (B), bases content along clean reads (C), and mean error distribution along clean reads (D). (E–G) DEGs in the OGDR group compared to the control group. Based on the quantitative results of the expression level, the differential gene analysis was carried out to obtain DEGs, the difference analysis software used was DESeq2, and the screening threshold was |log2FC| ≥ 1 and p-adjust < 0.05; p-value multiple test correction method: BH. (E) Histogram of DEGs: the red bar represents the upregulated genes and blue bar for the downregulated genes. (F) Heatmap of DEGs. (G) Volcano plot of DEGs: the red and blue plots refer to upregulated and downregulated genes, respectively.
FIGURE 2
FIGURE 2
Functional enrichment analysis of DEGs. The bar chart length represents the number of genes. (A) GO annotation analysis. The top 20 terms in abundance are shown, including 9 terms in BP, 8 terms in CC, and 3 terms in MF. (B) KEGG pathways. The top 20 KEGG pathways in abundance are shown. (C) Reactome pathways. The top 20 Reactome pathways in abundance are shown. (D) GO enrichment analysis. Screening threshold for significant enrichment, p-adjust ≤ 0.05. The top 20 enrichment terms in abundance are shown. The higher the rich factor, the more significant the enrichment. The sizes of the dots indicate the number of genes/transcripts in this GO term, and the color of the dot corresponds to different p-adjust ranges. The GO term with the most significant enrichment is the glutathione metabolic process (GO:0006749, rich factor: 0.0857142857143, term type: BP, p-adjust: 0.00109589801972).
FIGURE 3
FIGURE 3
Hub genes and ferroptosis-related DEGs. (A) Visual diagram of 207 DEG PPI network using Cytoscape, including 113 nodes and 207 edges. Screening out seven clusters and different colors for different clusters. Red for cluster 1 (6 genes, score: 5.200), light green for cluster 2 (7 genes, score: 4.000), dark green for cluster 3 (4 genes, score: 4.000), blue for cluster 4 (7 genes, score: 3.333), purple for cluster 5 (3 genes, score: 3.000), pink for cluster 6 (3 genes, score: 3.000), and orange for cluster 7 (3 genes, score: 3.000). Cluster 1 gets the highest score, and six genes (Ddit3, Atf3, Sesn2, Trib3, Gadd45a, and Ppp1r15a) were identified as the hub genes. (B) Network of hub genes. (C) Information on six hub genes. (D) Heatmap of 174 ferroptosis-related genes. (E) Venn diagram showing nine ferroptosis-related DEGs. Red circle represents 207 DEGs between groups, blue circle represents 174 ferroptosis-related genes, and the overlap represents nine ferroptosis-related DEGs. (F) Information about nine ferroptosis-related DEGs.
FIGURE 4
FIGURE 4
The correlation showed a significant correlation between the hub genes and ferroptosis-related DEGs, and their mRNA expression levels were verified by RT-qPCR. (A) Heatmap of the Spearman correlation between hub genes and ferroptosis-related DEGs by ChiPlot. Different colors represent different correlations (red represents a positive correlation, and blue represents a negative correlation). The circle size represents the correlation coefficient (the larger circle represents stronger correlation, and the smaller circle represents a weaker or less correlation). *p < 0.05; **p < 0.01; and ***p < 0.001. (B–N) Validation of hub genes and ferroptosis-related DEGs by RT-qPCR. (B–G) mRNA expression levels of Ddit3, Atf3, Sesn2, Trib3, Gadd45a, and Ppp1r15a. The mRNA expression trends of six hub genes were consistent with the RNA-seq results. (H–N) The mRNA expression levels of Slc3a2, Lcn2, Chac1, Slc7a11, Gch1, Ccn2, and Tfrc were analyzed. A total of nine ferroptosis-related DEGs showed the same trend as the results of RNA-seq.
FIGURE 5
FIGURE 5
Ferroptosis was involved in OGDR/IR injury. (A) Representative TEM images of the bEND.3 cells in the control and OGDR groups at different magnifications: mitochondrial shrinkage, density increases, mitochondrial crest disappears, and mitochondrial membrane ruptures. (B–E) Detection of ROS, Fe2+, GSSG, and MDA in bEND.3 cell samples. (B) Fluorescence detection of ROS. No obvious green fluorescent signal was detected in the control group. More green fluorescence signals were detected in the OGDR group. (C) bEND.3 cell Fe2+ content. (D) bEND.3 cell GSSG content. (E) bEND.3 cell MDA content. (F) Representative Prussian blue staining images of the cerebral cortex in the Sham group and IR group at different magnifications. Significant iron deposition (brown color) was observed in the IR group.
FIGURE 6
FIGURE 6
The protein expression levels of GPX4, SESN2, and System Xc− were analyzed by western blot and immunofluorescence in bEND.3 cells. Green fluorescence represents GPX4, SESN2, SLC7A11, or SLC3A2. Blue fluorescence labels the nucleus. (A) The expression level of GPX4 was significantly decreased during reoxygenation and re–glucose deprivation and reached the lowest at R12h. (B) Fer-1 pretreatment partly restored the expression of GPX4. (C) GPX4 expression was also analyzed by immunofluorescence. (D) Compared with the control group, the protein expression of SESN2 was significantly reduced in the OGDR group. (E–F) The ferroptosis-related System Xc− proteins SLC7A11 (E), and SLC3A2 (F) were analyzed by western blot and immunofluorescence.
FIGURE 7
FIGURE 7
The protein expression levels of SESN2 and ferroptosis-related proteins were analyzed by western blot and immunofluorescence in the cerebral cortex of IR. Green fluorescence represents HMOX1, SESN2, GPX4, SLC7A11, or SLC3A2. Red fluorescence labels microvascular endothelial cells. Blue fluorescence labels the nucleus. (A) Representative immunofluorescence staining of the mouse brain in the Sham and IR groups: HMOX1 (green) and nucleus (blue). (B) Compared with the Sham group, the protein expression of SESN2 was significantly reduced in the IR group. (C–E) The protein expression levels of GPX4 (C), SLC7A11 (D), and SLC3A2 (E) were analyzed by western blot and immunofluorescence after IR and showed a trend consistent with OGDR-treatment bEND.3 cells.
FIGURE 8
FIGURE 8
SESN2 was involved in OGDR-induced ferroptosis by regulating the System Xc−/GPX4 pathway. (A–C) Transfection efficiency of plasmid pcDNA3.1-SESN2 was verified by western blot (A, B) and RT-qPCR (C). (D–F) Interference efficiency of siRNA was verified by western blot (D–E) and RT-qPCR (F). (G–I) SESN2 overexpression upregulated the protein (G, H) and mRNA expression levels (I) of SLC7A11, SLC3A2, and GPX4. (J–L) SESN2 interference decreased the protein (J–K) and mRNA expression levels (L) of SLC7A11, SLC3A2, and GPX4.

Similar articles

Cited by

References

    1. Badgley M. A., Kremer D. M., Maurer H. C., Delgiorno K. E., Lee H.-J., Purohit V., et al. (2020). Cysteine depletion induces pancreatic tumor ferroptosis in mice. Science 368, 85–89. 10.1126/science.aaw9872 - DOI - PMC - PubMed
    1. Bao W.-D., Pang P., Zhou X.-T., Hu F., Xiong W., Chen K., et al. (2021). Loss of ferroportin induces memory impairment by promoting ferroptosis in Alzheimer’s disease. Cell Death and Differ. 28, 1548–1562. 10.1038/s41418-020-00685-9 - DOI - PMC - PubMed
    1. Cai W., Liu L., Shi X., Liu Y., Wang J., Fang X., et al. (2023). Alox15/15-HpETE aggravates myocardial ischemia-reperfusion injury by promoting cardiomyocyte ferroptosis. Circulation 147, 1444–1460. 10.1161/circulationaha.122.060257 - DOI - PubMed
    1. Campbell B. C. V., De Silva D. A., Macleod M. R., Coutts S. B., Schwamm L. H., Davis S. M., et al. (2019). Ischaemic stroke. Nat. Rev. Dis. Prim. 5, 70. 10.1038/s41572-019-0118-8 - DOI - PubMed
    1. Campbell B. C. V., Khatri P. (2020). Stroke. Lancet 396, 129–142. 10.1016/s0140-6736(20)31179-x - DOI - PubMed

LinkOut - more resources