

Socio-economic inequalities in minimum dietary diversity among Ethiopian children aged 6-23 months: a decomposition analysis
- PMID: 39944573
- PMCID: PMC11815660
- DOI: 10.3389/fpubh.2024.1422563
Socio-economic inequalities in minimum dietary diversity among Ethiopian children aged 6-23 months: a decomposition analysis
Abstract
Background: Globally, inappropriate feeding practices account for more than two-thirds of all cases of child mortality during the first 2 years of a child's life. For a long time, Ethiopia has suffered from the double burden of malnutrition: overnutrition and undernutrition both pose significant challenges, particularly for children. Undernutrition is mainly caused by wealth and educational disparities across the country. Therefore, this study aimed to assess the socio-economic inequalities in minimum dietary diversity (MDD) practices among Ethiopian children aged 6-23 months and the potential contributing factors.
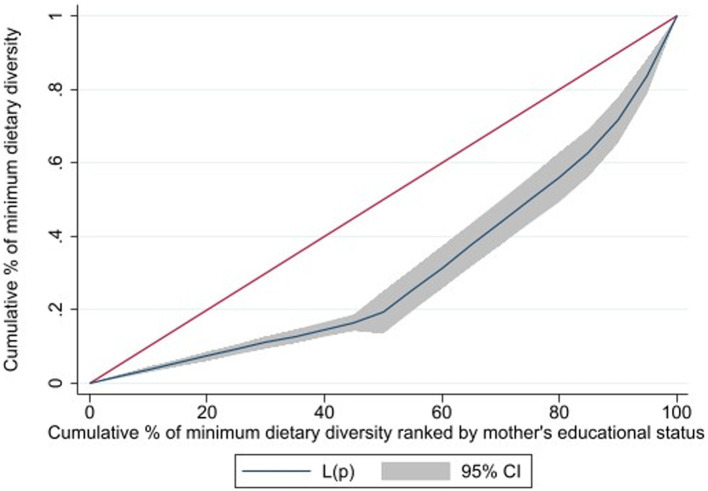
Methods: The study utilized the recent datasets of the Ethiopia Mini Demographic and Health Survey (EMDHS) of 2019. A total of 1,511 weighted samples were included in the research. Microsoft Excel and STATA v.14 software were employed to extract, clean, and analyze data. A probit model decomposition analysis was performed. The concentration index (CIX) and curve were used to examine household wealth status and maternal education level inequalities in the MDD.
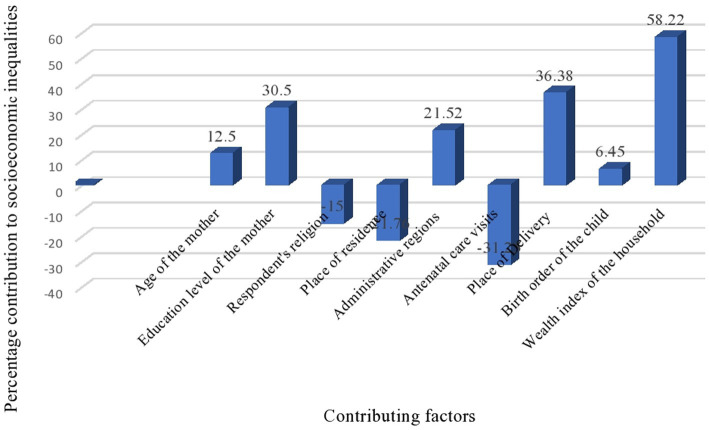
Results: The total weighted prevalence of MDD among children under the age of 5 in Ethiopia was 13.5%. Wealth and educational status show positive CIX values for inequality, as exhibited by the concentration curve under the equality line. The CIX with household and maternal education status were (CIX: 0.1034, p < 0.0029) and (CIX: 0.1057, p < 0.0002), respectively. This indicates a greater concentration of inequalities among privileged women. The decomposition analysis revealed that household wealth status, (58.23%) contributed by wealth status, (36.38%) place of delivery, (30.47%) maternal education, and (21.5%) administration region, explained the pro-rich inequalities in MDD in Ethiopia.
Conclusion: This study identified significant inequalities in terms of wealth and maternal educational level in the context of MDD. Policymakers and healthcare workers should develop effective strategies to tackle the underlying causes of inequalities in attaining MDD, specifically focusing on household wealth and maternal education.
Keywords: Ethiopia; concentration curve; concentration index; decomposition analysis; dietary diversity; inequities; socioeconomic inequality.
Copyright © 2025 Worku, Workie, Yohannes, Getnet, Negash, Yeshambel Belay, Asmare, Alemu, Geberu, Jejaw, Demissie, Tiruneh and Hagos.
Conflict of interest statement
The authors declare that the research was conducted in the absence of any commercial or financial relationships that could be construed as a potential conflict of interest.
Figures

Similar articles
-
Decomposing socioeconomic inequality in the dietary diversity practice among children aged 6-23 months in Ethiopia.Sci Rep. 2025 May 19;15(1):17282. doi: 10.1038/s41598-025-02366-4. Sci Rep. 2025. PMID: 40389605 Free PMC article.
-
Wealth- and education-related inequalities in minimum dietary diversity among Indonesian infants and young children: a decomposition analysis.Glob Health Action. 2022 Dec 31;15(1):2040152. doi: 10.1080/16549716.2022.2040152. Glob Health Action. 2022. PMID: 35389332 Free PMC article.
-
Socio-economic inequalities in minimum dietary diversity among Bangladeshi children aged 6-23 months: a decomposition analysis.Sci Rep. 2022 Dec 15;12(1):21712. doi: 10.1038/s41598-022-26305-9. Sci Rep. 2022. PMID: 36522494 Free PMC article.
-
Dietary Diversity and Associated Factors among Children 6-23 Months Old in Ethiopia: Systematic Review and Meta-Analysis.Discov Med. 2024 Jul;36(186):1527-1543. doi: 10.24976/Discov.Med.202436186.141. Discov Med. 2024. PMID: 39054722
-
Socio-economic inequalities in malaria prevalence among under-five children in Ghana between 2016 and 2019: a decomposition analysis.Malar J. 2025 May 8;24(1):147. doi: 10.1186/s12936-025-05349-y. Malar J. 2025. PMID: 40340795 Free PMC article. Review.
Cited by
-
Trends and inequalities of minimum dietary diversity among children aged 6-23 months in Sierra Leone, 2013-2019.BMC Public Health. 2025 May 17;25(1):1822. doi: 10.1186/s12889-025-22891-1. BMC Public Health. 2025. PMID: 40382538 Free PMC article.
References
-
- Institute EPH : Assessment of status of infant and young child feeding (IYCF) practice, policy and programs: achievements and gaps in Ethiopia. (2016). Available at: http://repository.iifphc.org/handle/123456789/475
-
- United Nations Children’s Fund . (UNICEF), World Health Organization (WHO), International Bank for Reconstruction and Development/The World Bank. Levels and trends in child malnutrition: UNICEF / WHO / World Bank Group Joint Child Malnutrition Estimates: Key findings of the (2023). New York: UNICEF and WHO.
-
- WHO . Global nutrition targets 2025: policy brief series (WHO/NMH/NHD/14.2). Geneva: World Health Organization. (2014).
-
- WHO Consultation on Obesity (1999: Geneva, Switzerland) and World Health Organization. (2000) Obesity: preventing and managing the global epidemic: report of a WHO consultation. World Health Organization. Available at: https://iris.who.int/handle/10665/42330 - PubMed
MeSH terms
LinkOut - more resources
Full Text Sources