. 2025 Apr;37(4):e70002.
doi: 10.1111/jne.70002. Epub 2025 Feb 13.

NETest® 2.0-A decade of innovation in neuroendocrine tumor diagnostics

Affiliations

NETest® 2.0-A decade of innovation in neuroendocrine tumor diagnostics

M Kidd et al. J Neuroendocrinol. 2025 Apr.

Abstract

Gastroenteropancreatic neuroendocrine neoplasms (GEP-NENs) are challenging to diagnose and manage. Because there is a critical need for a reliable biomarker, we previously developed the NETest, a liquid biopsy test that quantifies the expression of 51 neuroendocrine tumor (NET)-specific genes in blood using real-time PCR (NETest 1.0). In this study, we have leveraged our well-established laboratory approach (blood collection, RNA isolation, qPCR) with contemporary supervised machine learning methods and expanded training and testing sets to improve the discrimination and calibration of the NETest algorithm (NETest 2.0). qPCR measurements of RNA-stabilized blood-derived gene expression of 51 NET markers were used to train two supervised classifiers. The first classifier trained on 78 Controls and 162 NETs, distinguishing NETs from controls; the second, trained on 134 stable disease samples, 61 progressive disease samples, differentiated stable from progressive NET disease. In all cases, 80% of data was retained for model training, while remaining 20% were used for performance evaluation. The predictive performance of the AI system was assessed using sensitivity, specificity, and Area under Received Operating Characteristic curves (AUROC). The algorithm with the highest performance was retained for validation in two independent validation sets. Validation Cohort #I consisted of 277 patients and 186 healthy controls from the United States, Latin America, Europe, Africa and Asia, while Validation Cohort #II comprised 291 European patients from the Swiss NET Registry. A specificity cohort of 147 gastrointestinal, pancreatic and lung malignancies (non-NETs) was also evaluated. NETest 2.0 Algorithm #1 (Random Forest/gene expression normalized to ATG4B) achieved an AUROC of 0.91 for distinguishing NETs from controls (Validation Cohort #I), with a sensitivity of 95% and specificity of 81%. In Validation Cohort #II, 92% of NETs with image-positive disease were detected. The AUROC for differentiating NETs from other malignancies was 0.95; the sensitivity was 92% and specificity 90%. NETest 2.0 Algorithm #2 (Random Forest/gene expression normalized to ALG9) demonstrated an AUROC of 0.81 in Validation Cohort #I and 0.82 in Validation Cohort #II for differentiating stable from progressive disease, with specificities of 81% and 82%, respectively. Model performance was not affected by gender, ethnicity or age. Substantial improvements in performance for both algorithms were identified in head-to-head comparisons with NETest 1.0 (diagnostic: p = 1.73 × 10⁻⁹; prognostic: p = 1.02 × 10⁻¹⁰). NETest 2.0 exhibited improved diagnostic and prognostic capabilities over NETest 1.0. The assay also demonstrated improved sensitivity for differentiating NETs from other gastrointestinal, pancreatic and lung malignancies. The validation of this tool in geographically diverse cohorts highlights their potential for widespread clinical use.

Keywords: NETest; biomarker; diagnostic accuracy; neuroendocrine tumor; qPCR.


Conflict of interest statement

MK and AH are employees of Wren Laboratories. IAD has consulted for Wren Laboratories and is a shareholder at Bering Limited. JS has received research support from ITM, Novartis, Radi‐omedix and RayzeBio and has consulted for Boehringer‐Ingelheim. AC, GC, DA, AG, TT and VP have no conflicts.

Figures

FIGURE 1
FIGURE 1
Overview of Wren's NETest workflow. RF = random forest.
FIGURE 2
FIGURE 2
NETest 2.0 model performance on the out‐of‐sample testing dataset. (A) AUROC curve demonstrating discriminating performance between NETs and Controls. (B) Calibration curve comparing predicted versus actual NET probability. (C) Boxplots showing model probability values across NETs (n = 32) and Controls (n = 16). The boxes represent the quartiles of the dataset, while the whiskers extend to display the rest of the distribution. Outliers are shown as circles. NET, neuroendocrine tumors; ROC, receiver operating characteristic; AUC, area under the curve.
FIGURE 3
FIGURE 3
NETest 2.0 model performance on the out‐of‐sample testing dataset. (A) AUROC curve demonstrating the discriminating performance between Progressive and Stable disease samples. (B) Calibration curve comparing predicted versus actual Progressive probability. (C) Boxplots showing model probability values across Stable (n = 27) and Progressive NETs (n = 12). The boxes represent the quartiles of the dataset, while the whiskers extend to display the rest of the distribution. Outliers are shown as circles. NET, neuroendocrine tumors; ROC, receiver operating characteristic; AUC, area under the curve.
FIGURE 4
FIGURE 4
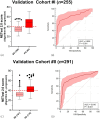
NETest 2.0 Algorithm #1 performance in two independent validation cohorts. (A). Box and whisker (Tukey) plot of NETest scores in Controls versus NETs (Cohort #I). Median and interquartile ranges are provided. (B) Receiver Operating Characteristic Curve for differentiating NETs from Controls in Cohort #I (n = 463). Shaded areas represent 95% CI. (C) Box and whisker (Tukey) plot of NETest scores in Cohort #II in the IND and IPD groups. Median and interquartile ranges are provided. Con, controls; NET, neuroendocrine tumors; AUC, area under the curve; IND, image‐non‐detectable; IPD, image‐positive‐disease. Red dashed line is the cut‐point for NET detection (50).
FIGURE 5
FIGURE 5
NETest 2.0 Algorithm #1 performance in other diseases. (A) Box and whisker (Tukey) plot of NETest scores in other cancers (Evaluation Cohort #I). (B) Receiver Operating Characteristic Curve for differentiating NETs (Cohort I + II, n = 568) from other cancers (n = 147, Evaluation Cohort #I). (C) Box and whisker (Tukey) plot of NETest scores in Evaluation Cohort #II (SCLC). (D) Box and whisker (Tukey) plot of NETest scores in Evaluation Cohort #III (IPF). AUC, area under the curve; IPF, interstitial pulmonary fibrosis; SCLC, small cell lung cancer. Median and interquartile ranges are provided. Red dashed line is the cut‐point for NET detection (50). Shaded areas represent 95% CI for the AUROC plot.
FIGURE 6
FIGURE 6
NETest 2.0 Algorithm #2 performance in two independent validation cohorts. (A) Box and whisker (Tukey) plot of Scores in Progressive versus Stable disease in the Validation Cohort #I. Median and interquartile ranges are provided. (B) ROC Curve for differentiating Progressive from Stable disease in Validation Cohort #I. Shaded areas represent 95% CI. (C) Box and whisker (Tukey) plot of Scores in Progressive versus Stable disease in Validation Cohort #II. Median and interquartile ranges are provided. (D) ROC Curve for differentiating Progressive from Stable disease in Validation Cohort #II. Shaded areas represent 95% CI. SD, stable disease; PD, progressive disease; AUC, area under the curve. Red dashed line is the cut‐point for progressive disease (40).
FIGURE 7
FIGURE 7
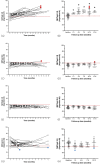
Longitudinal evaluation of NETest scores (Algorithm #1 and Algorithm #2) in 4 different cohorts. (A, B) Follow‐up in 25 surgically resected patients with either no positive margins (R0) or microscopic residual disease (R1). Scores (Algorithm #1—Diagnostic) increase with time since surgery. Two patients (red circles) developed image‐detectable disease during the follow‐up period. (C, D) In 20 patients with clinically stable disease [watch & wait/surveillance], the prognostic score (Algorithm #2) was stable (<40) over the follow‐up. One patient's score (red circle) was >40 concordant with the development of disease progression. This was confirmed on imaging. (E, F) In 20 patients undergoing treatment, Algorithm #2 scores were all <40 consistent with disease stability (and response to therapy). (G, H) In 25 patients with progressive disease, scores were >40 in 90% of cases. Two patients responded to therapy with disease stabilization (blue circles). Both exhibited scores <40 consistent with good therapeutic responses. Individual scores (A, C, E, and G) and scores grouped in 3 monthly intervals (B, D, F, and H) are included. (A, B) Red dashed line is the cut‐point for NET detection (50). (C–H) Red dashed line is the cut‐point for progressive disease (40).
FIGURE 8
FIGURE 8
Advantages and limitations of the NETest.

References

    1. Yao JC, Hassan M, Phan A, et al. One hundred years after “carcinoid”: epidemiology of and prognostic factors for neuroendocrine tumors in 35,825 cases in the United States. J Clin Oncol. 2008;26(18):3063‐3072. - PubMed
    1. Kulke MH, Siu LL, Tepper JE, et al. Future directions in the treatment of neuroendocrine tumors: consensus report of the National Cancer Institute neuroendocrine tumor clinical trials planning meeting. J Clin Oncol. 2011;29(7):934‐943. - PMC - PubMed
    1. Larson MH, Pan W, Kim HJ, et al. A comprehensive characterization of the cell‐free transcriptome reveals tissue‐ and subtype‐specific biomarkers for cancer detection. Nat Commun. 2021;12(1):2357. - PMC - PubMed
    1. Ginghina O, Hudita A, Zamfir M, et al. Liquid biopsy and artificial intelligence as tools to detect signatures of colorectal malignancies: a modern approach in Patient's stratification. Front Oncol. 2022;12:856575. - PMC - PubMed
    1. Modlin IM, Kidd M, Drozdov IA, et al. Development of a multigenomic liquid biopsy (PROSTest) for prostate cancer in whole blood. Prostate. 2024;84(9):850‐865. - PubMed

MeSH terms

Substances

Supplementary concepts