. 2025 Feb;29(3):e70400.
doi: 10.1111/jcmm.70400.

Hypoxia-Induced Metabolic and Functional Changes in Oral CSCs: Implications for Stemness and Viability Modulation Through BNIP3-Driven Mitophagy

Affiliations

Hypoxia-Induced Metabolic and Functional Changes in Oral CSCs: Implications for Stemness and Viability Modulation Through BNIP3-Driven Mitophagy

Xin Li et al. J Cell Mol Med. 2025 Feb.

Abstract

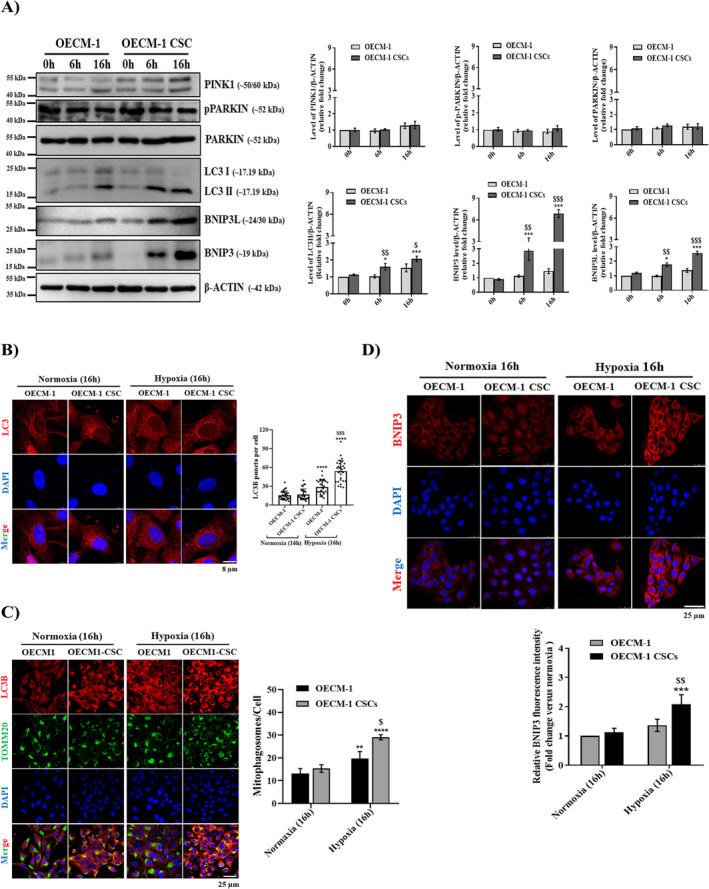
Oral squamous cell carcinomas (OSCCs), like several solid tumours, contain heterogeneous subpopulations of a small subset of cancer cells, termed cancer stem cells (CSCs), that are highly relevant to cancer metastasis and invasive properties. CSCs have also shown a high capacity to survive against various stressful environments, such as hypoxia. However, the molecular underpinnings behind the high potential of CSCs to survive under this stress remain unclear. The current study aimed to investigate the significance of autophagy systems in oral CSC maintenance and survival under stress conditions. Human OSCC cell lines OECM-1 and OECM-1 CSCs were cultured in different hypoxic time periods for proliferation and cytotoxicity analyses. The stemness property of CSCs is evaluated by sphere formation, transwell and wound healing assays protein expression of stemness, and epithelial-to-mesenchymal transition markers. Mitochondrial functions, including mitochondrial ROS generation, mitochondria dynamics, mitophagy, and mitochondrial metabolism (glycolysis and oxidative phosphorylation [OXPHOS]) were examined by western blotting, immunohistochemistry, and XF-seahorse assays, respectively. Under hypoxia, oral CSCs showed a higher proliferation rate with increased invasion/migration/EMT properties than OECM-1 cells. Further, hypoxia-induced BNIP3-driven mitophagy was activated in OECM-1 CSCs than in OECM-1 cells, which also triggered a metabolic shift towards OXPHOS, and BNIP3/-L silencing by siRNA significantly attenuated OECM-1 CSCs stemness features. TCGA data analyses also revealed a higher BNIP3 expression in head and neck squamous carcinoma patients' tumour samples associated with lower patient survival. Collectively, our results revealed a BNIP3/-L-driven autophagy contributes to the OECM-1 CSCs stemness features under hypoxia, suggesting a novel therapeutic strategy involving BNIP3 and autophagy inhibition in oral CSCs.

Keywords: BNIP3/‐L; Mitophagy; autophagy; cancer stem cells; oral squamous cell carcinoma; oxidative phosphorylation.


Conflict of interest statement

The authors declare no conflicts of interest.

Figures

FIGURE 1
FIGURE 1
Functional validation and characterisation of OECM‐1 CSCs by cell morphology and stemness markers analysis. (A) Representative images show cell morphology and sphere‐like bodies in growth factor (EGF and bFGF) added OECM‐1 cultured cells within 10 days, wherein OECM‐1 cells transformed into stem‐like cells. Scale bar = 25.0 μm. (B) Western blotting analysis of the stemness marker protein expression (CD44, NANOG, OCT4 and SOX2) in both OECM‐1 and OECM‐1 CSCs. Data presented are mean ± SD (n = 3). *p < 0.05, **p < 0.01 and ***p < 0.001 versus OECM‐1 cells.
FIGURE 2
FIGURE 2
OECM‐1 CSC have higher survival rates than OECM‐1 under hypoxia exposure. (A) OECM‐1 and OECM‐1 CSCs were exposed to hypoxia for different time periods (0, 6, 16 and 24 h) and examined for cell viability using the CCK8 assay. Significance is ascribed as **p < 0.01 versus OECM‐1 and OECM‐1 CSC control (normoxia). (B) Representative confocal images of hypoxia‐exposed OECM‐1 and OECM‐1 CSCs immunostained with anti‐Ki‐67 (a prominent marker of proliferation). The quantification of Ki67+ staining data is represented as the count of Ki67+ cells per total number of cells. Scale bar = 25.0 μm. (C) Cell cytotoxicity was measured in hypoxia‐treated OECM‐1 and OECM‐1 CSCs after 6, 16 and 24 h using the LDH cytotoxicity assay. The data for cell viability and cytotoxicity are presented as percentages and fold change, respectively, and statistically described as mean ± SD. (D) Representative confocal images of cleaved caspase‐3 immunostaining in both normoxic and hypoxic OECM‐1 and OECM‐1 CSCs for 0, 6 and 16 h. Scale bar = 25.0 μm. Statistically, the data are presented as mean ± SD. Significance is ascribed as *p < 0.5, **p < 0.01 and ***p < 0.001 versus OECM‐1 and OECM‐1 CSC control (normoxia); $ p < 0.05, $$ p < 0.01, $$$ p < 0.001 and p < 0.0001 versus hypoxia‐exposed OECM‐1 cells. These experiments were independently carried out more than three times.
FIGURE 3
FIGURE 3
OECM‐1 CSCs exhibit higher migration and invasion capacity and EMT‐like phenotypes than OECM1 under hypoxia. (A) Representative microscopic images of the wound healing assay of 16 h exposed OECM‐1 and OECM‐1 CSCs under normoxic and hypoxic conditions. Scale bar = 100.0 μm. The graphs show the percentage of area covered. (B) Representative microscopic images of the invasion assay in normoxic and 16 h hypoxia‐exposed OECM‐1 and OECM‐1 CSCs. Scale bar = 100.0 μm. Graphs show the average number of invaded cells per field. (C) The expression of EMT‐marker proteins in both normoxic and hypoxic OECM‐1 and OECM‐1 CSCs was examined using western blot analysis with β‐Actin as the endogenous loading control. Data are presented as mean ± SD. Significance is ascribed as *p < 0.5, **p < 0.01 and ***p < 0.001 versus OECM‐1 and OECM‐1 CSCs control (normoxia); $ p < 0.5, $$ p < 0.01 and $$$ p < 0.01 versus hypoxia‐exposed OECM‐1 cells. These data were carried out independently more than three times.
FIGURE 4
FIGURE 4
Lower levels of ROS and mitochondrial dysfunction in hypoxia‐exposed OECM‐1 CSCs. Representative confocal microscopic images showing (A) DCFDA (as an indicator of general ROS level) (scale bar = 25.0 μm) and (B) Mito‐SOX (as an indicator of mitochondrial O2 level) measured in OECM‐1 and OECM‐1 CSCs cultured under normoxic or hypoxic conditions for 6 and 16 h. Scale bar = 25.0 μm. (C) Representative images of mitochondrial membrane potential measured by JC‐1 fluorescence dye (aggregates, red; monomers, green) in normoxia‐ and hypoxia‐exposed OECM‐1 and OECM‐1 CSCs for 16 h. Scale bar = 25.0 μm. Data are presented as mean ± SD and obtained from more than three independent experiments. Significance is ascribed as *p < 0.5 and ***p < 0.001 versus OECM‐1 and OECM‐1 CSCs control (normoxia); $$ p < 0.01 and $$$ p < 0.001 versus hypoxia‐exposed OECM‐1 cells.
FIGURE 5
FIGURE 5
OECM‐1 CSCs exhibit an enhanced rate of mitochondrial fission compared to OECM‐1 cells under hypoxia. (A) Representative confocal microscopic images show the mitochondrial morphology examined by mitotracker staining in OECM‐1 and OECM‐1 CSCs cultured either in normoxia or a hypoxia chamber for 6 and 16 h. Scale bar, 25.0 μm. (B) Western blot analysis shows levels of the mitochondrial fusion (MFN1, MFN2, and OPA1) and fission (pDRP1 and DRP1) proteins in normoxia‐ and hypoxia‐exposed OECM‐1 and OECM‐1 CSCs for 6 and 16 h. Immunofluorescence images of DRP1 (C) and MFN1 (D) in cultured cells of OECM‐1 and OECM‐1 CSCs either exposed to normoxia or hypoxia for 16 h (scale bar, 25.0 μm). Data are presented as mean ± SD and performed independently more than three times. Significance is ascribed as *p < 0.5, **p < 0.01 and ***p < 0.001 versus OECM‐1 and OECM‐1 CSCs control (normoxia); $ p < 0.05 and $$ p < 0.01 versus hypoxia‐exposed OECM‐1 cells.
FIGURE 6
FIGURE 6
Hypoxia‐exposed OECM‐1 CSCs exhibit enhanced levels of mitophagy and autophagy. (A) Western blot analysis showing levels of the mitophagy/autophagy markers (PINK1, PARKIN, pPARKIN, LC3I/II, BNIP3, and BNIP3L) in the whole‐cell lysates of normoxia‐ and hypoxia‐exposed OECM‐1 and OECM‐1 CSCs for 6 and 16 h. (B) Representative immunofluorescence images of LC3B staining (quantification presented as number of LC3B puncta/cell) (scale bar, 8.0 μm), co‐localised LC3B and TOMM20 (C), and BNIP3 (D) in cultured cells of OECM‐1 and OECM‐1 CSCs that were either exposed to normoxia or hypoxia for 16 h (scale bar, 25.0 μm). Values are mean ± SD, with replicates performed independently more than three times. Significance is ascribed as *p < 0.5, **p < 0.01, ***p < 0.01 and ****p < 0.0001 versus OECM‐1 and OECM‐1 CSCs control (normoxia); $ p < 0.05, $$ p < 0.01 and $$$ p < 0.01 versus hypoxia‐exposed OECM‐1 cells.
FIGURE 7
FIGURE 7
Hypoxia‐exposed OECM‐1 CSCs exhibit increased mitochondrial metabolism reprogramming. (A) The oxygen consumption rate (OCR), an indicator of mitochondrial OXPHOS and (B) The extracellular acidification rate (ECAR), an indicator of glycolytic metabolism were measured using the Seahorse 96 XF analyser in normoxia‐ and hypoxia‐exposed OECM‐1 and OECM‐1 CSCs, normalised per μg of protein. Both OECM‐1 and OECM‐1 CSC cells were injected at indicated times with oligomycin (ATP synthase inhibitor), FCCP, rotenone, 2‐DG, glucose, and antimycin. Values are mean ± SD and were performed in independent replicates more than three times. Significance is ascribed as *p < 0.5, **p < 0.01 and ***p < 0.001 versus OECM‐1 and OECM‐1 CSC control (normoxia); $$ p < 0.01 versus hypoxia‐exposed OECM‐1 cells.
FIGURE 8
FIGURE 8
BNIP3 enhanced the migration and invasion properties and suppressed mitochondrial dysfunction in OECM‐1 CSCs under hypoxic conditions that promote stemness capacity. To elucidate whether BNIP3/‐L‐induced autophagy was involved in the stemness functions of oral CSCs under hypoxia exposure, siRNA‐targeting BNIP3 (siBNIP3) was used to silence BNIP3 expression. (A) Western blots were performed to examine the effects of siRNA on BNIP3 expression, and densitometry analysis graphs represent the band signal intensity as a fold change. (B) Representative confocal microscope images showing the localisation of LC3 in OECM‐1, OECM‐1 CSCs, siBNIP3‐1 and siBNIP3‐2 OECM‐1 CSCs under both normoxic and hypoxic conditions using TOMM20 (a receptor for proteins targeted to the outer mitochondrial membrane) staining along with graphs showing fluorescence integrated density in the OECM‐1, OECM‐1 CSCs, siBNIP3‐1 and siBNIP3‐2 OECM‐1 CSCs. Scale bar = 25.0 μm. (C) A 96 XF‐Seahorse analyser assay was performed to measure the OCR rate in the aforementioned cells under normoxic and hypoxic conditions. Representative graphs quantifying the rates of basal respiration, ATP‐linked respiration, and maximal respiration are shown. (D) MitoSOX (5 μM) was used to measure mitochondrial O2 production and the graph quantifies the fluorescent intensity of MitoSOX as fold change in the OECM‐1, OECM‐1 CSCs, siBNIP3‐1, and siBNIP3‐2 OECM‐1 CSCs under both normoxic and hypoxic conditions. Scale bar = 25.0 μm. (E, F) The effect of BNIP3 silencing on cell proliferation and cytotoxicity was determined using CCK8 and LDH assays, respectively, with representative graphs quantifying the rate of cell viability and cytotoxicity of OECM‐1, OECM‐1 CSCs, and siBNIP3‐infected OECM‐1 CSCs under both normoxic and hypoxic conditions after 16 h treatment. (G) A scratch wound healing assay was applied to examine the migration of the indicated cells, and a graph quantifying the rate of migrating cells is provided. Scale bar = 100.0 μm. Rates are expressed as fold change. (H) Representative images of invasion in the aforementioned ed. cells and a graph quantifying the number of invading cells are shown. Scale bar = 100.0 μm. Protein expressions of stemness markers CD44, OCT4, NANOG, and SOX2 (I) and EMT markers E‐CADHERIN, FIBRONECTIN, GSK3‐α/β, VIMENTIN, SNAIL, and SLUG (J) were determined using Western blot assays in the indicated cells. Data are represented as mean ± SD and performed with more than three independent replicates. Significance is ascribed as *p < 0.5, **p < 0.01 and ***p < 0.001 versus OECM‐1 and OECM‐1 CSCs control (normoxia); $ p<0.05, $$ p < 0.01 and $$$ p<0.001 versus hypoxia‐exposed OECM‐1 cells; # p < 0.05 and ## p < 0.01 versus hypoxia‐exposed OECM‐1 CSCs.
FIGURE 9
FIGURE 9
BNIP3 expression was significantly upregulated in cancers, including head and neck squamous carcinoma (HNSC). (A) The TCGA database showed that BNIP3 expression was upregulated in HNSC primary tumour samples compared to normal tissue samples. (B) Survival analysis using the HNSC Kaplan–Meier Plotter revealed that patients with higher BNIP3 expression are associated with poorer overall survival.
FIGURE 10
FIGURE 10
Schematic diagram depicting the role of BNIP3 in maintaining oral CSCs and their survival under hypoxic stress conditions.

Similar articles

References

    1. Singhavi H. R., Chakrabarti S., Singh A., et al., “Comparison of the Seventh and Eighth Editions American Joint Committee Cancer Classification System in Oral Cavity Squamous Cell Cancers,” International Journal of Cancer 146, no. 12 (2020): 3379–3384. - PubMed
    1. Hema K. N., Smitha T., Sheethal H. S., and Mirnalini S. A., “Epigenetics in Oral Squamous Cell Carcinoma,” Journal of Oral and Maxillofacial Pathology 21, no. 2 (2017): 252–259. - PMC - PubMed
    1. Hawkins A. T., Wise P. E., Chan T., et al., “Diverticulitis: An Update From the Age Old Paradigm,” Current Problems in Surgery 57, no. 10 (2020): 100862. - PMC - PubMed
    1. Warnakulasuriya S., “Global Epidemiology of Oral and Oropharyngeal Cancer,” Oral Oncology 45, no. 4–5 (2009): 309–316. - PubMed
    1. Ernani V. and Saba N. F., “Oral Cavity Cancer: Risk Factors, Pathology, and Management,” Oncology 89, no. 4 (2015): 187–195. - PubMed

MeSH terms