. 2025 Apr;12(13):e2411408.
doi: 10.1002/advs.202411408. Epub 2025 Feb 13.

A Feedback Loop Driven by H4K12 Lactylation and HDAC3 in Macrophages Regulates Lactate-Induced Collagen Synthesis in Fibroblasts Via the TGF-β Signaling

Affiliations

A Feedback Loop Driven by H4K12 Lactylation and HDAC3 in Macrophages Regulates Lactate-Induced Collagen Synthesis in Fibroblasts Via the TGF-β Signaling

Ying Zou et al. Adv Sci (Weinh). 2025 Apr.

Abstract

The decrease in fibroblast collagen is a primary contributor to skin aging. Lactate can participate in collagen synthesis through lysine lactylation by regulating gene transcription. However, the precise mechanism by which lactate influences collagen synthesis requires further investigation. This study demonstrates that the depletion of macrophages mitigates the stimulating effect of lactate on collagen synthesis in fibroblasts. Through joint CUT&Tag and RNA-sequencing analyses, a feedback loop between H4K12 lactylation (H4K12la) and histone deacetylase 3 (HDAC3) in macrophages that drives lactate-induced collagen synthesis are identified. Macrophages can uptake extracellular lactate via monocarboxylate transporter-1 (MCT1), leading to an up-regulation of H4K12la levels through a KAT5-KAT8-dependent mechanism in response to Poly-L-Lactic Acid (PLLA) stimulation, a source of low concentration and persistent lactate, thereby promoting collagen synthesis in fibroblasts. Furthermore, H4K12la is enriched at the promoters of TGF-β1 and TGF-β3, enhancing their transcription. Hyperlactylation of H4K12la inhibits the expression of the eraser HDAC3, while the activation of HDAC3 reduces H4K12la in macrophages and suppresses collagen synthesis in fibroblasts. In conclusion, this study illustrates that macrophages play a critical role in lactate-induced collagen synthesis in the skin, and targeting the lactate-H4K12la-HDAC3-TGF-β axis may represent a novel approach for enhancing collagen production to combat skin aging.

Keywords: H4K12 lactylation; collagen synthesis; fibroblasts; lactate; macrophages.


Conflict of interest statement

The authors declare no conflict of interest.

Figures
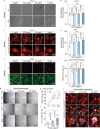
Figure 1
Figure 1
PLLA is safe to macrophages and promotes their migration and phagocytosis. a) BMDMs were treated with varying concentrations (0, 0.25, 0.5, and 1 mg mL−1) of PLLA for 72 h. Cellular morphology was observed using a phase contrast microscope. b) Cell viability was evaluated using the Cell Counting Kit‐8 (CCK8). “n.s” indicating no significance. c) BMDMs were treated with (0, 0.25, 0.5, and 1 mg mL−1) of PLLA for a duration of 72 h. The live cell marker, tubulin, was stained using a Live‐cell Tubulin‐tracker. d) Cell viability was measured using the MTT assay. “n.s” indicating no significance. e,f) Calcein‐AM/PI staining was performed to measure the percentages of live cells, “n.s” indicating no significance. g,h) The effects of PLLA in macrophages migration were examined by wound healing assay, representative images of the wound healing assay in BMDMs and statistical analysis of wound healing assay in BMDMs. * p < 0.05. i,j) Double immunofluorescence staining for F4/80‐stained macrophages (red fluorescence) and fluorescence lumispheres (green fluorescence), and quantification of the lumispheres number per macrophage. * p < 0.05.
Figure 2
Figure 2
Macrophages promote lactate‐induced collagen synthesis in fibroblasts both in vivo and in vitro. a) Experimental protocol for the animal procedure including injections, sampling, and experiment termination for histological studies and western blotting. Group 1 was termed as control group; Group 2 was injected with clodronate liposomes only; Group 3 was injected with PLLA only; Group 4 was combination of PLLA and clodronate liposomes injection. PBS and saline were used for solvent controls of clodronate liposomes and PLLA, respectively. b) Collagen I (red fluorescence) and collagen III (green fluorescence) immunofluorescence in skin, F4/80 (green fluorescence) immunofluorescence in skin, and blue fluorescence refers to DAPI. And histological analysis of Masson staining in each group. c) Relative density of fluorescence density was normalized to group 1. * p < 0.05. d) The relative collagen density was quantified, refers to Masson staining. * < 0.05. e,f) Western blotting analysis of proteins from skin samples, the relative protein levels of F4/80, collagen I, and collagen III were quantified. * p < 0.05. g) Macrophage‐fibroblast co‐culture in vitro system. Macrophages were seeded in the upper chamber; fibroblasts were seeded in the lower chamber. h,i) Western blotting analysis of collagen I and collagen III protein levels in fibroblast (lower chamber), the relative protein levels of collagen I and collagen III were quantified. * p < 0.05.
Figure 3
Figure 3
H4K12 lactylation (H4K12la) is increased in response to lactate stimulation in macrophages. a) BMDMs were treated with or not treated with 0.5 mg mL−1 PLLA for 72 h, lactate contents in the cell free supernatant and whole cell lysate from PLLA‐treated BMDMs and control BMDMs. “n.s” indicating no significance, * p < 0.05. b,c) Western blotting analysis of pan Kla levels in BMDMs treated or not treated with PLLA, and the relative pan Kla levels were normalized to β‐actin. * < 0.05. d) Fluorescence images of macrophages treated with 0.5 mg mL−1 PLLA for 72 h using FiLa sensor to visualize intracellular lactate. e–g) Western blotting analysis of H3K9la, H3K14la, H3K18la, H3K23la, H3K56la, H4K8la, H4K12la, and H4K16la in BMDMs treated or not treated with PLLA, and the relative the indicated histone lactylation levels were normalized to β‐actin. “n.s” indicating no significance, * p < 0.05. h,i) Double immunofluorescence staining for F4/80‐stained macrophages (green fluorescence) and H4K12la (red fluorescence), and quantification of H4K12la fluorescence normalized to control group. * p < 0.05.
Figure 4
Figure 4
Macrophages uptake lactate via MCT1 after being treated with PLLA. a,b) qPCR analysis of MCT1‐MCT14 in BMDMs, the mRNA levels were normalized to β‐actin. “n.s” indicating no significance, * p < 0.05. c,d) Western blotting analysis of MCT1 and MCT14 in BMDMs treated or not treated with PLLA, and the relative MCT1 and MCT14 levels were normalized to β‐actin. * p < 0.05. e,f) Three pairs of MCT1 siRNAs were designed and synthesized, and the silencing efficiency of these siRNAs in macrophages was confirmed by western blotting analysis of MCT1 expression, the relative MCT1 levels were normalized to β‐actin. “n.s” indicating no significance, * p < 0.05. g,h) Two pairs of MCT14 siRNAs were designed and synthesized, and the silencing efficiency of these siRNAs in macrophages was confirmed by western blotting analysis of MCT14 expression, with relative levels normalized to β‐actin. * p < 0.05. i,j) MCT1 inhibitor AZD3965 or k,l) MCT1 siRNAs were used for inhibiting MCT1 in macrophages in the presence of PLLA, western blotting analysis of MCT1 and H4K12la in BMDMs and the relative MCT1 and H4K12la levels were normalized to normalized to β‐actin. * p < 0.05. m,n) MCT14 siRNAs were utilized to inhibit MCT14 in macrophages in the presence of PLLA. Western blotting analysis was conducted to assess H4K12la levels in BMDMs, with the relative levels of MCT14 and H4K12la normalized to β‐actin. “n.s” indicating no significance, * p < 0.05.
Figure 5
Figure 5
Lactylation writers KAT5 and KAT8 collaboratively promotes H4K12la in macrophages. a,b) Western blotting analysis of potential lactylation writers including p300, KAT8, KAT2A, KAT5, and AARS1 in BMDMs treated with or not treated with PLLA for 72 h, the relative protein levels were normalized to β‐actin. “n.s” indicating no significance, * p < 0.05. c–e) Western blotting analysis of KAT8, and KAT5 expression in siNC‐transfected, siKAT8‐transfected, siKAT5‐transfected BMDMs, the relative protein levels were normalized to β‐actin. “n.s” indicating no significance, * < 0.05. f,g) Western blotting analysis of H4K12la levels in BMDMs after KAT8 knockdown in the presence of PLLA, the relative H4K12 levels were normalized to β‐actin. * < 0.05. h,i) Western blotting analysis of H4K12la levels in BMDMs after KAT5 knockdown in the presence of PLLA, the relative H4K12 levels were normalized to β‐actin. * < 0.05.
Figure 6
Figure 6
RNA‐seq analysis revealed ECM‐receptor interaction and TGF‐β signaling are involved in macrophages in response to lactate stimulation. a) BMDMs were exposed to 0.5 mg ml−1 PLLA for 72 h, while untreated cells served as the control group. RNA‐seq was performed on these cells, resulting in the identification of 528 up‐regulated genes and 38 down‐regulated genes in BMDMs. A heatmap was used to visualize the differential gene expression between the control group and PLLA‐treated‐BMDMs. b) Enriched GO analysis was conducted on the up‐regulated expressed genes. c) Analysis of KEGG pathway enrichment was conducted on the up‐regulated expressed genes, highlighting their involvement in critical processed related to ECM‐receptor interaction and TGF‐β signaling. d,e) GSEA analysis demonstrating ECM‐receptor interaction is positive correlation with PLLA treatment in BMDMs, a heatmap was used to visualize the top 20 up‐regulated genes involved in ECM‐receptor interaction. f,g) GSEA analysis demonstrating TGF‐β signaling pathway is positive correlation with PLLA treatment in BMDMs, a heatmap was used to visualize the top 20 up‐regulated genes involved in TGF‐β signaling.
Figure 7
Figure 7
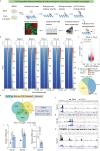
Identification of downstream targets of H4K12la by genome‐wide CUT&Tag analysis. a) Schematic of BMDMs treated with 0.5 mg mL−1 PLLA for 72 h and used for CUT&Tag analysis to identify the downstream targets of H4K12la. b) The binding density of H4K12la was visualized by deepTools: the heatmap presents the CUT&Tag tag counts on the different H4K12la binding peaks in BMDMs between control group and treated group. c) A volcano plot was generated to visualize the overall changes in H4K12la‐binding peaks between control BMDMs or PLLA‐treated BMDMs. d) The genome‐wide distribution of differential H4K12la‐binding peaks was analyzed between control BMDMs and PLLA‐treated BMDMs. e) Bioinformatics analysis filtered Tgfb as a downstream target of H4K12la in macrophages. f–h) IGV tracks for TGF‐β1, TGF‐β3, and lactylation eraser HDAC3 from CUT&Tag analysis. i,j) qPCR assay of TGF‐β1, TGF‐β3, and HDAC3 mRNA expression in PLLA‐treated BMDMs. * < 0.05.
Figure 8
Figure 8
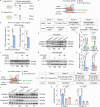
Macrophages enhance collagen synthesis in fibroblasts by secreting TGF‐β in the presence of lactate. a,b) BMDMs were treated with 0.5 mg mL−1 PLLA for 72 h, after which the cell‐free supernatant and whole cell lysate (WCL) were collected for TGF‐β ELISA. * < 0.05. c) A flow chart of the in vitro co‐culture system, where macrophages were seeded in the upper chamber and fibroblasts in the lower chamber, TGFβR1 and TGFβR2 siRNAs were utilized to knock down the expression of TGF‐β1 receptors in fibroblasts. d,e) Western blotting analysis of collagen I and collagen III in the fibroblasts collected from the lower chamber, the relative protein levels of collagen I and collagen III were normalized to β‐actin. * < 0.05. f–h) BMDMs were transfected with either TGF‐β1 siRNAs or TGF‐β3 siRNAs and subsequently treated with 0.5 mg mL−1 PLLA. Western blotting analysis was performed to detect the protein levels of TGF‐β1 and TGF‐β3 in BMDMs. “n.s” indicating no significance, * p < 0.05. i) A chart of the in vitro co‐culture system illustrates that macrophages were seeded in the upper chamber while fibroblasts were in the lower chamber, with TGF‐β1 and TGF‐β3 siRNAs used to knock down the expression of TGF‐β1 and TGF‐β3 in macrophages. j,k) Western blotting analysis of collagen I and collagen III in fibroblasts collected from the lower chamber, the relative protein levels of collagen I and collagen III were normalized to β‐actin. * p < 0.05.
Figure 9
Figure 9
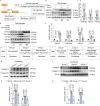
A feedback loop driven by H4K12la and HDAC3 in macrophages activates TGF‐β transcription and promotes collagen synthesis in fibroblasts. a) Schematic of the feedback loop driven by H4K12 lactylation (H4K12la) and Kla eraser HDAC3, and the regulatory relationship between H4K12la and TGF‐β. b,c) Western blotting analysis of H4K12la, TGF‐β1, and TGF‐β3 in the BMDMs treated or not treated with HDAC3 activator ITSA‐1 in the presence of PLLA, the relative protein levels were normalized to β‐actin. * p < 0.05. d,e) Western blotting analysis of HDAC3, H4K12la, TGF‐β1, and TGF‐β3 in the BMDMs that were either transfected with HDAC3 overexpressing plasmids or not, in the presence of PLLA, the relative protein levels were normalized to β‐actin. * p < 0.05. f) Using the in vitro co‐culture system, macrophages were seeded in the upper chamber, and treated or not treated with HDAC3 activator ITSA‐1 in the presence of PLLA, whereas fibroblasts were seeded in the lower chamber. g,h) Western blotting analysis of collagen I and collagen III in the fibroblasts collected from the lower chamber, the relative protein levels of collagen I and collagen III were normalized to β‐actin. * p < 0.05, refer to f. i) Using the in vitro co‐culture system, macrophages were seeded in the upper chamber, and transfected or not transfected with HDAC3 overexpressing plasmids in the presence of PLLA, while fibroblasts were seeded in the lower chamber. j,k) Western blotting analysis of collagen I and collagen III in the fibroblasts collected from the lower chamber, the relative protein levels of collagen I and collagen III were normalized to β‐actin. * p < 0.05, refer to i.
Figure 10
Figure 10
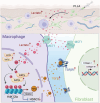
A proposed working model for how macrophage participates in lactate‐induced collagen synthesis in fibroblasts through a lactate‐H4K12la‐HDAC3‐TGF‐β axis. Graphics in Figure 10 were created using BioRender.com (https://biorender.com/).

References

    1. Quan T., J. Dermatol. Sci. 2023, 112, 48. - PubMed
    1. He X., Gao X., Xie W., Int. J. Mol. Sci. 2023, 24, 15930. - PMC - PubMed
    1. Chin T., Lee X. E., Ng P. Y., Lee Y., Dreesen O., Front. Physiol. 2023, 14, 1297637. - PMC - PubMed
    1. Agrawal R., Hu A., Bollag W. B., Biology 2023, 12, 1396. - PMC - PubMed
    1. Wang T., Ye Z., Li Z., Jing D. S., Fan G. X., Liu M. Q., Zhuo Q. F., Ji S. R., Yu X. J., Xu X. W., Qin Y., Cell Proliferation 2023, 56, e13478. - PMC - PubMed

LinkOut - more resources