. 2025 Apr 25;64(18):e202420874.
doi: 10.1002/anie.202420874. Epub 2025 Feb 28.

Synthetic High-Throughput Microarrays of Peptidoglycan Fragments as a Novel Sero-Diagnostic Tool for Patient Antibody Profiling

Affiliations

Synthetic High-Throughput Microarrays of Peptidoglycan Fragments as a Novel Sero-Diagnostic Tool for Patient Antibody Profiling

Alexandra Tsouka et al. Angew Chem Int Ed Engl. .

Abstract

Peptidoglycan (PGN) is a complex biopolymer crucial for cell wall integrity and function of all bacterial species. While the strong inflammatory properties of PGN and its derived muropeptides are well-documented in human innate immune responses, adaptive immunity, including antibody responses to PGN, remain inadequately characterized. Microarray technology represents a cost- and time-efficient method for studying such interactions. Our laser-based technology enables the high-throughput synthesis of biomolecules on functionalized glass slides. Here, this on-chip synthesis was developed for PGN fragments, to generate a variety of 216 stem peptides and attach six different glycan moieties that are major structural components of bacterial cell walls. Thereby, 864 PGN fragments from different Gram-negative and Gram-positive species were generated. The arrays were validated with four different monoclonal antibodies against PGN or poly-N-acetyl glucosamine and identified their epitopes. Finally, proof of concept for antibody profiling in patient samples was performed by comparing a panel of well-characterized plasma samples of epidermolysis bullosa (EB) patients suffering from (chronic) wounds with Staphylococcus aureus infection. EB patients show an increased response to the muramyl dipeptide. Therefore, this novel high-throughput PGN glycopeptide microarray technology promises to identify distinct antibody profiles against human microbiomes in diseases, notably in those involving the intestine.

Keywords: antibodies; autoimmunity; epidermolysis bullosa (EB); laser-induced forward transfer (LIFT); solid phase synthesis.


Conflict of interest statement

F.F.L. is named on a patent application related to laser‐based microarray synthesis. P.H.S. declares a significant financial interest in GlycoUniverse GmbH & Co. KGaA, the company that commercialized AGA synthesis instruments, building blocks, and other reagents. All other authors declare that they have no competing interests.

Figures

Figure 1
Figure 1
Peptidoglycan structure and sequence variation of the stem peptide. The different glycan strands are branching from the MurNAc residues with the stem peptides. The length of the stem peptides can be up to 5AA long, while the interpeptide bridge (IPB), connecting the two stem peptides may contain up to seven AA, typically polyglycine. l/d‐Ala: l/d‐alanine; l‐Arg: l‐arginine; l‐Cit: l‐citrulline; l‐Gly: l‐glycine; l‐Glu: l‐glutamic acid; d‐iGlu: d‐isoglutamic acid, l/d‐iGln: l/d‐isoglutamine; l‐Hsr: l‐homoserine; l/d‐Lys: l/d‐lysine; mDAP: meso‐diaminopimelic acid; l‐Orn: l‐ornithine; l/d‐Ser: l/d‐serine.
Figure 2
Figure 2
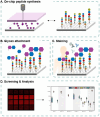
PGN microarray synthesis and screening. A) Synthesis of peptide microarrays via LIFT. B) Attachment of glycan molecules. C) Antibody signal after plasma incubation. D) Fluorescence scan and analysis of fluorescence intensities.
Figure 3
Figure 3
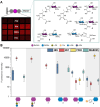
Generation of PGN fragment arrays on different surface linker functionalizations for epitope mapping of monoclonal antibodies. A) Surface functionalization by l‐aspartic acid (l‐Asp), l‐alanine (l‐Ala), 3,6‐dioxaoctanoic acid (8O2Oc), and 8‐aminooctanoic acid (8Aoc), on the commercial PEGMA/MMA‐β‐Ala functionalized solid support and attachment of the glycan moieties via amide bond formation. B) Representative analysis of the fluorescence intensities on l‐Asp array functionalization after incubation with mouse anti‐PGN monoclonal 2E9, mouse anti‐PGN monoclonal 2E7, mouse anti‐PGN monoclonal MAB995, and human anti‐PNAG monoclonal F598. Detection was achieved with goat anti‐mouse IgG polyclonal and goat anti‐human IgG polyclonal antibodies respectively. Box plots (center line, median; box limits, upper and lower quartiles; whiskers, outermost data point that falls within 1.5×interquartile range) were calculated from 125 spots for each linker pre‐functionalization (Supporting Information).
Figure 4
Figure 4
Generation of combinatorial PGN microarrays. A) Identification of lasing parameters and quantification of AA coupling by fluorescence labeling of amino groups. Example fluorescence (DyLight) staining of l‐Ala pattern with increasing laser parameters. B) Validation of the conditions and visualization by direct and indirect staining of l‐Ala, d‐Ala, l‐Lys, l‐Orn, d‐iGln (top five AAs, left to right), d‐iGlu, l‐Gln, l‐Ser, l‐iGln, d‐Ser (bottom five AAs, left to right). C, D) Optimal conditions were used for the generation of PGN arrays. Heat map of the array screening of 216 pentapeptide variations bearing the respective glycan moieties: C) MurNAc 3 and D) dimer 4, incubated with monoclonal mouse anti‐PGN 2E9, 2E7, MAB995, and monoclonal human anti‐PNAG F598. Detection with goat anti‐mouse IgG polyclonal and goat anti‐human IgG polyclonal antibodies respectively. Fluorescence intensity was determined as the median of three spot replicas.
Figure 5
Figure 5
IgG response from healthy non‐carriers (NC), healthy carriers (C) of S. aureus, and epidermolysis bullosa (EB) patients on β‐Ala‐l‐Asp surface functionalization. EB sample groups: JEB (*), DEB (−), EBS sample (+). Detection was achieved with a fluorescently labelled goat anti‐human IgG polyclonal antibody. Box plots (center line, median; box limits, upper and lower quartiles; whiskers, outermost data point that falls within 1.5×interquartile range) were calculated from 125 spots.

References

    1. Schleifer K. H., Kandler O., Bacteriol. Rev. 1972, 36, 407–477. - PMC - PubMed
    1. M. F. Dwayne C. Savage, Bacterial Adhesion, Springer US, Boston, MA, 1985.
    1. Wheeler R., Gomperts Boneca I., Gut Microbes 2024, 16, 2395099. - PMC - PubMed
    1. Wang M., Buist G., van Dijl J. M., FEMS Microbiol. Rev. 2022, 46, 1–19. - PMC - PubMed
    1. Garde S., Chodisetti P. K., Reddy M., EcoSal Plus 2021, 9, 1–35. - PMC - PubMed

MeSH terms

LinkOut - more resources