. 2025 May 2;15(5):988-1017.
doi: 10.1158/2159-8290.CD-23-0882.

The Germline and Somatic Origins of Prostate Cancer Heterogeneity

Takafumi N Yamaguchi #  1   2   3   4 Kathleen E Houlahan #  1   2   3   4   5   6   7 Helen Zhu #  1   5   6   8 Natalie Kurganovs #  1   8   9   10 Julie Livingstone #  1   2   3   4 Natalie S Fox #  1   2   3   4   5 Jiapei Yuan  11 Jocelyn Sietsma Penington  12 Chol-Hee Jung  13 Tommer Schwarz  14   15 Weerachai Jaratlerdsiri  16 Job van Riet  17 Peter Georgeson  13 Stefano Mangiola  9   10   12 Kodi Taraszka  18 Robert Lesurf  1 Jue Jiang  19 Ken Chow  9   10   20 Lawrence E Heisler  1 Yu-Jia Shiah  1 Susmita G Ramanand  11 Michael J Clarkson  9   10 Anne Nguyen  9   10 Shadrielle Melijah G Espiritu  1 Ryan Stuchbery  9   10 Richard Jovelin  1 Vincent Huang  1 Connor Bell  21 Edward O'Connor  21 Patrick J McCoy  9   10 Christopher M Lalansingh  1 Marek Cmero  9   10   12 Adriana Salcedo  1   2   3   4   5 Eva K F Chan  22   23 Lydia Y Liu  1   2   3   4   5   6 Phillip D Stricker  23 Vinayak Bhandari  1   5 Riana M S Bornman  24 Dorota H S Sendorek  1 Andrew Lonie  13 Stephenie D Prokopec  1 Michael Fraser  1   8 Justin S Peters  9   10 Adrien Foucal  1 Shingai B A Mutambirwa  25 Lachlan Mcintosh  12 Michèle Orain  26 Matthew Wakefield  12 Valérie Picard  27 Daniel J Park  13 Hélène Hovington  27 Michael Kerger  9 Alain Bergeron  27 Veronica Sabelnykova  1 Ji-Heui Seo  21 Mark M Pomerantz  21 Noah Zaitlen  28   29 Sebastian M Waszak  30   31 Alexander Gusev  32   33   34 Louis Lacombe  27 Yves Fradet  27 Andrew Ryan  35 Amar U Kishan  3   36 Martijn P Lolkema  18   37 Joachim Weischenfeldt  38   39   40 Bernard Têtu  26 Anthony J Costello  9   10   20 Vanessa M Hayes  22   23   24   41   42 Rayjean J Hung  43   44 Housheng H He  5   8 John D McPherson  1   5 Bogdan Pasaniuc  3   4   15   29 Theodorus van der Kwast  8 Anthony T Papenfuss  13   45   46   47   48 Matthew L Freedman  21   32   49 Bernard J Pope  10   13   50   51   52 Robert G Bristow  5   8   53 Ram S Mani  11   54 Niall M Corcoran #  9   10   20   55   56 Jüri Reimand #  1   5 Christopher M Hovens #  9   10 Paul C Boutros #  2   3   4   5   6   57
Affiliations

The Germline and Somatic Origins of Prostate Cancer Heterogeneity

Takafumi N Yamaguchi et al. Cancer Discov. .

Abstract

This study uncovered 223 recurrently mutated driver regions using the largest cohort of prostate tumors to date. It reveals associations between germline SNPs, somatic drivers, and tumor aggression, offering significant insights into how prostate tumor evolution is shaped by germline factors and the timing of somatic mutations.


Conflict of interest statement

N.S. Fox reports grants from Prostate Cancer Canada during the conduct of the study. R.M.S. Bornman reports grants from the Department of Defense during the conduct of the study. M. Fraser reports a patent for “Methods and systems for prostate cancer characterization and treatment” pending to University Health Network and a patent for “Multi-modal prostate cancer marker” issued to University Health Network. M. Wakefield reports grants from Stanford Fox Mediacal Research Foundation during the conduct of the study, as well as nonfinancial support from Clovis Oncology and AstraZeneca outside the submitted work. A.U. Kishan reports honorarium and research support from Varian Medical Systems, Lantheus, Point Biopharma, and Janssen, honorarium from Boston Scientific and Novartis, research support from Artera, and grant support from the Department of Defense and NIH. M.P. Lolkema reports personal fees from Roche and Amgen, grants and personal fees from Sanofi, JnJ, MSD, and grants from KWF (Dutch Cancer Foundation) and NWO (Dutch Governmental Science Fund) during the conduct of the study. M.L. Freedman reports personal fees from Precede Biosciences outside the submitted work. N.M. Corcoran reports grants and personal fees from AstraZeneca and Bayer, personal fees from Astellas, and nonfinancial support from SillaJen outside the submitted work. P.C. Boutros reports grants from Prostate Cancer Canada, the Canadian Cancer Society, the Canadian Institutes for Health Research, the Prostate Cancer Foundation, the Department of Defense PCRP, and the NIH/NCI during the conduct of the study, as well as other support from BioSymetrics Inc., Intersect Diagnostics Inc., and Sage Bionetworks outside the submitted work; in addition, P.C. Boutros has multiple issued and pending patents on prostate cancer biomarkers. No disclosures were reported by the other authors.

Figures
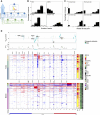
Figure 1.
Figure 1.
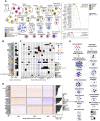
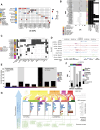
Mutation rates of prostate tumors. A, Schematic roadmap of the key analyses conducted in this study, offering insights into the genomic origins of the ISUP GG. B, Distributions of somatic mutation frequency for SNVs, indels, mtSNVs, and GRs across 666 tumor–reference WGS pairs. INV, inversions; CTX, interchromosomal translocations. C, Distributions of somatic clonal and subclonal CNA frequency (number of base-pairs) for losses and gains. D, Clonal and subclonal CNA landscape of localized prostate cancer. Heatmaps represent CNA profiles for the cohort split by CNA occurring clonally or subclonally. Columns represent genes and rows represent patients, grouped by subtype, then sorted by ISUP GG, and clustered within the GG. The top two panels show clonal–subclonal differences in CNA frequency (FTrunk – FBranch) of the dominant CNA type and statistical significance −log10(Q value) calculated using Pearson’s χ2 test with FDR adjustment. To avoid confounding by subclonal whole-genome duplication, patients with subclonal PGA >80% (9/664) were excluded from this statistical analysis. (A, Created with BioRender.com.)
Figure 2.
Figure 2.
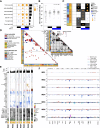
Somatic driver mutations in localized prostate cancer. Driver mutation discovery in 666 localized prostate tumors. The top barplot shows the distribution of the number of drivers in patients; the covariates on the left show the region type and statistical significance from ActiveDriverWGS and GISTIC. The top heatmap shows drivers found in this study (rows) for each patient (columns). The bottom heatmap shows drivers found in an exome meta-analysis (14). Heatmaps are colored by mutation type. Right barplot shows the number of drivers per patient. Bottom covariate bars show clinical features of patients. Gene labels on the left are for rows identified by tick-marks on the axis. Schematics above each set of legends indicate the panels to which they apply in yellow. For example, the top set of legends apply to the regional covariate heatmaps on the left side of the plot.
Figure 3.
Figure 3.
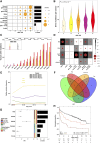
Functional characterization of driver mutations. A, Network diagrams represent multimodal pathway enrichment analysis of driver genes. Mutation types (i.e., the type of driver analysis) are indicated by shading of circles. Circle size represents the number of patients. Heatmaps show mutations in the cohort that affect genes contributing to two exemplar pathways dysregulated by multiple mutation types. The apoptosis pathway (GO:0042771 – intrinsic apoptotic signaling pathway in response to DNA damage by p53 class mediator), was identified to be significant only in the context of integrating statistical significance from all GR, and SNV, and indel driver analyses in coding and regulatory elements. The embryonic development pathway (GO:0043009 chordate embryonic development) was identified to be independently significant using SNVs and indels in regulatory elements, in coding elements, and in the Armenia and colleagues (14) dataset. Bottom covariates on the heatmaps show CNAs in pathway genes identified in driver CNA peaks (analyzed using GISTIC2). B, Associations between driver events and SBS signatures. Dot size and dot colors indicate median difference of signature activity. Background shading shows Q values from the Wilcoxon rank-sum test with FDR adjustment. Drivers and SBSs were ordered using hierarchical clustering. C, A summary of associations between driver events and mRNA abundance of driver genes. Dot size and colors indicate median difference of mRNA abundance. Background shading shows Q values from the Wilcoxon rank-sum test with FDR adjustment. D, Consensus clustering of 3,318 dysregulated mRNAs associated with driver mutations. Colors in the heatmap indicate median difference of mRNA abundance between patients with and without a specific driver mutation. Driver mutation type is on the left using colors from A. The right barplot shows the number of transcripts significantly associated with each driver mutation. E, Pathway enrichment analysis on the four mRNA subtypes from D. Clusters of biologically similar pathways are labeled and outlined for each subtype. The size of the pathway is indicative of the number of enriched genes. For (B and C) CNA drivers in patients with subclonal PGA >80% were excluded, and only driver events significantly associated with either SBS signatures or mRNA abundances are shown. (A, Created with BioRender.com.)
Figure 4.
Figure 4.
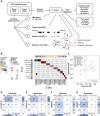
Mutational subtypes of localized prostate cancer. A, Mutation densities (rows) differ by ETS fusion and NKX3-1 CNA status (columns). Dot size and color gives effect-size as a Z-score, scaled to ETS-negative, NKX3-1–neutral patients. The barplot on the right shows the FDR-adjusted P values from nonparametric Kruskal–Wallis tests. B, Comparison of log10-transformed SNV mutation rate for patients divided by ETS fusion and NKX3-1 CNA status. P value is from a nonparametric Kruskal–Wallis test. C, Using a generalized linear model, eight driver mutations were identified whose frequency differed by ETS fusion and/or NKX3-1 CNA status after FDR adjustment for multiple-testing. Dot size and color indicate the difference in proportion, scaled to patients with ETS-negative, NKX3-1–neutral tumors. Background grayscale represents Q values from a proportion test. D, Co-occurrence and associations of driver region pairs across 666 localized prostate tumors. For each pair of driver regions, a hypergeometric test was used to assess whether more mutations were detected than expected by chance alone (co-occurrence) or fewer (mutual exclusivity) after FDR adjustment for multiple-testing (Q < 0.05). The bottom-left heatmap shows all driver pairs; the dotmap on the top right provides effect sizes (dots) and Q values for a subset. Yellow stars on the heatmap mark drivers which are the same gene in clonal and subclonal CNAs. Dot size reflects the difference in driver events, quantified as the observed number minus the expected number. Color indicates deviation direction. The red circle signifies more driver events than expected by chance, whereas the upside-down blue triangle indicates fewer events than expected. E, Clustering of driver regions identifies seven patient subtypes: IMS1–IMS7. Columns are patients. The bottom set of rows shows clinical characteristics, the second set shows mutation densities, and the third shows driver mutations whose frequency differs between subtypes (proportion test; Q < 0.05). The top barplot gives the number of mutated driver regions for each patient. F, Summary subtype profiles showing the proportion of patients in the subtype with certain aberrations. In the positive direction, the proportion of clonal CNA gains, subclonal CNA gains, select GRs, and select SNVs. The lollipops show the proportion of patients for GRs and SNVs. In the negative direction, the proportion of patients in the subtype with clonal and subclonal CNA losses is shown. For each subfigure, CNAs in patients with subclonal PGA >80% were excluded. INV, inversions.
Figure 5.
Figure 5.
Mutational hallmarks of prostate cancer grade. A, A linear model was fit to relate each mutational density measure to ISUP GG using tumor and normal sequencing coverage as covariates. Dot size and color represents the effect size for each ISUP GG as a Z-score relative to ISUP GG 1. The barplot to the right shows the Q value from a nonparametric Kruskal–Wallis test. B, Distribution of the number of driver mutations per tumor in each ISUP GG; the median per GG is shown by a black dot. P value is from a one-way ANOVA. C, Genes whose mutation frequency is univariately associated with ISUP GG, ordered by the percentage of samples with mutations in ISUP GG 5 tumors. FDR-adjusted P values from the Pearson χ2 test are shown. D, Two-sided Spearman correlation between clinical covariates and measures of genomic instability with dot size showing the magnitude of correlation and background color representing the statistical significance. E, Consensus clustering identified four groups of genes with similar patterns of change across age categories. For each gene cluster, the median mutation frequency for each age category is shown, along with the number of genes in each cluster. F, Venn diagram of the driver genes that were statistically associated with clinical features. G, Cox proportional hazard models were fit for the driver regions that were associated with clinical features. Significant regions after FDR adjustment are shown, as well as the driver type and clinical feature the region was associated with. H,MYC clonal and subclonal gains were associated with biochemical relapse. For each subfigure, CNAs in patients with subclonal PGA >80% were excluded. INV, inversions; WT, wild-type.
Figure 6.
Figure 6.
dQTLs bias somatic mutational landscape. A, Schematic of dQTL detection. The PRS used was by Schumacher and colleagues (16). Linear local dQTLs were assessed within ±500 kbp around a driver. Spatial local dQTLs were evaluated using regions defined by RNA Pol-II ChIA-PET profiling in LNCaP, DU145, VCaP, and RWPE-1 cell lines and RAD21 ChIA-PET in LNCaP and DU145 cells. Enhancer regions were defined using H3K27ac HiChIP profiling in LNCaP cells. All discovered dQTLs were tested for replication in six replication cohorts. B, Summary of 26 dQTLs involving 25 unique variants. Dot size and color indicate the magnitude and direction of ORs between the SNP and somatic driver. Background shading indicates P values. Covariate on left indicates type of somatic mutation; the top covariate indicates the analysis strategy for the discovery cohort . C, Comparison of ORs in the discovery vs. replication cohort for tag dQTLs. Horizontal and vertical dotted lines represent OR = 1, and the diagonal line represents y = x. Halo around points indicates replication of direction, diamond around points indicates Q < 0.1 in the replication cohort, and dot color indicates the somatic driver. D and E, Contingency tables for rs11203152 association with clonal loss of TMPRSS2 in (D) discovery and (E) replication cohorts. F and G, Contingency tables of rs848048 associated with SNVs in FOXA1 3′ UTR in (F) discovery and (G) replication cohorts.
Figure 7.
Figure 7.
Characterization of dQTLs. A, Summary of all 35 dQTLs involving 25 unique SNPs. Dot size and color indicate the magnitude and direction of association (as OR), and background shading indicates dQTL discovered strategy. B, Forest plot of OR and 95% confidence interval for dQTL associations across 1,991 prostate tumors. Background shading indicates Q < 0.1. The middle covariate indicates the driver mutation, and the right heatmap indicates cohorts included in the analysis. C, Summary of molecular and clinical characterization of dQTLs. Gray indicates dQTL was association with methylation (meQTL), RNA abundance (eQTL), protein abundance (pQTL), transcription factor–binding, histone modification, ISUP GG, BCR, or risk of prostate cancer diagnosis (PCa Risk). Left covariate indicates somatic drivers. D, rs11203152 is located within regulatory dense region. Tracks show chromatin looping anchored by RNAPII, RAD21, AR, or ERG in RWPE-1, LNCaP, VCaP, or DU145 cell lines. E, The number of chromatin loops was higher than expected by chance in LNCaP and VCaP cell lines. Barplots shows the number of anchors within one Mbp of rs11203152. Bottom covariate indicates cell line and target, whereas background shading indicates significant enrichment (Q < 0.05). The red X indicates the expected number of chromatin loop anchors based on 100,000 randomly sampled, equally sized regions. F, dQTLs may explain differences in somatic mutation frequencies across ancestries. Barplot shows the risk of acquiring a FOXA1 SNV or T2E in African (green) or Asian (purple) ancestry relative to European ancestry. The estimated percent of this risk explained by rs848048 (FOXA1) or rs11203152 (T2E) is indicated above the bar. The top covariate indicates ancestry: African in green and Asian in purple. Somatic mutation direction relative to European ancestry is indicated as higher (pink) vs. lower (teal). G, Schematic overview of primary prostate cancer evolution into ISUP GGs. The vertical blue arrow illustrates the temporal relationship between the germline context and driver mutations and the roles they play in tumor evolution. The germline SNPs (bottom) were found to be associated with driver acquisition illustrated by connecting lines. The somatic driver mutation frequency across IMSs is visualized using barplots. The horizontal arrow indicates increasing genomic instability across subtypes and ISUP GGs (9). The Sankey plot connects the IMSs and ISUP GGs, indicating the nondeterministic association between driver acquisition and clinical presentation, while noting the potential role of the tumor microenvironment (90) and epigenetics (45) (G, Created with BioRender.com.)

References

    1. Siegel RL, Miller KD, Fuchs HE, Jemal A. Cancer statistics. CA Cancer J Clin 2021;71:7–33. - PubMed
    1. Smith BD, Smith GL, Hurria A, Hortobagyi GN, Buchholz TA. Future of cancer incidence in the United States: burdens upon an aging, changing nation. J Clin Oncol 2009;27:2758–65. - PubMed
    1. Hamdy FC, Donovan JL, Lane JA, Mason M, Metcalfe C, Holding P, et al. . 10-Year outcomes after monitoring, surgery, or radiotherapy for localized prostate cancer. N Engl J Med 2016;375:1415–24. - PubMed
    1. Epstein JI, Egevad L, Amin MB, Delahunt B, Srigley JR, Humphrey PA, et al. . The 2014 International Society of Urological Pathology (ISUP) consensus conference on Gleason grading of prostatic carcinoma: definition of grading patterns and proposal for a new grading system. Am J Surg Pathol 2016;40:244–52. - PubMed
    1. D’Amico AV, Whittington R, Malkowicz SB, Fondurulia J, Chen MH, Kaplan I, et al. . Pretreatment nomogram for prostate-specific antigen recurrence after radical prostatectomy or external-beam radiation therapy for clinically localized prostate cancer. J Clin Oncol 1999;17:168–72. - PubMed