. 2025 May 30;23(2):qzaf005.
doi: 10.1093/gpbjnl/qzaf005.

Resolving Leukemia Heterogeneity and Lineage Aberrations with HematoMap

Affiliations

Resolving Leukemia Heterogeneity and Lineage Aberrations with HematoMap

Yuting Dai 代雨婷 et al. Genomics Proteomics Bioinformatics. .

Abstract

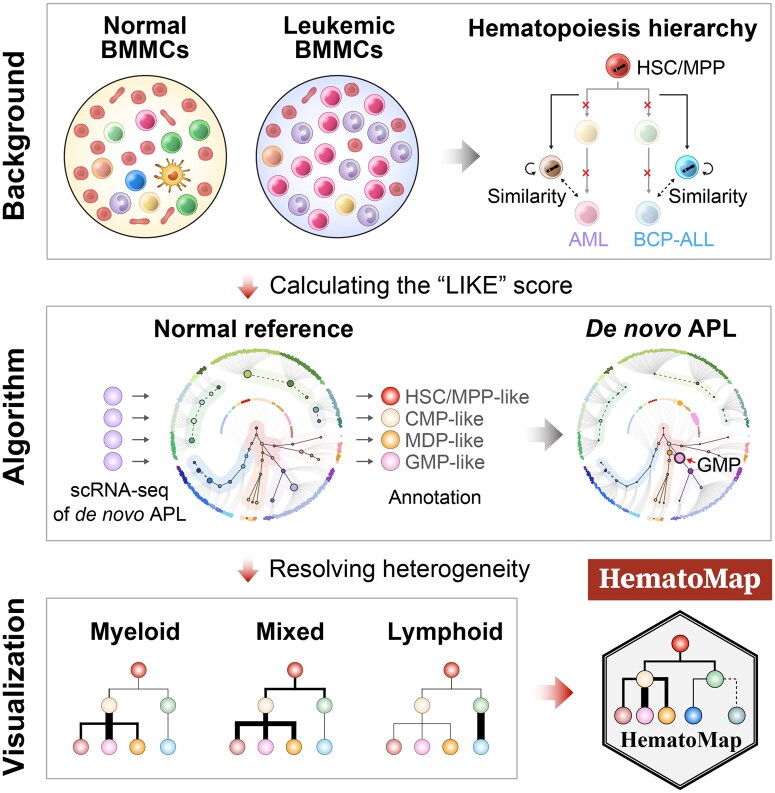
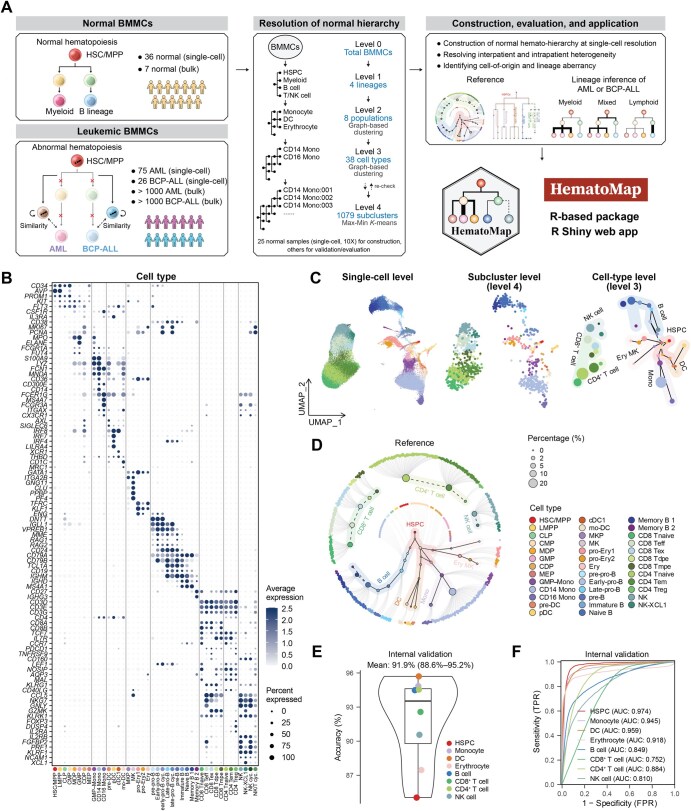
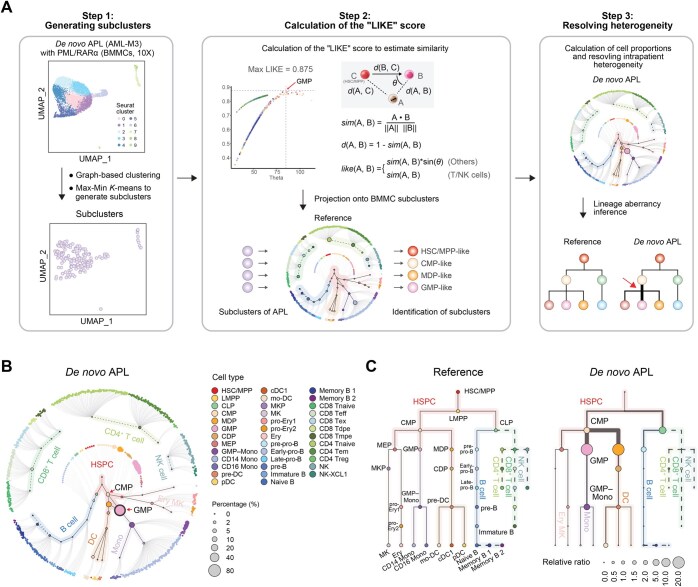
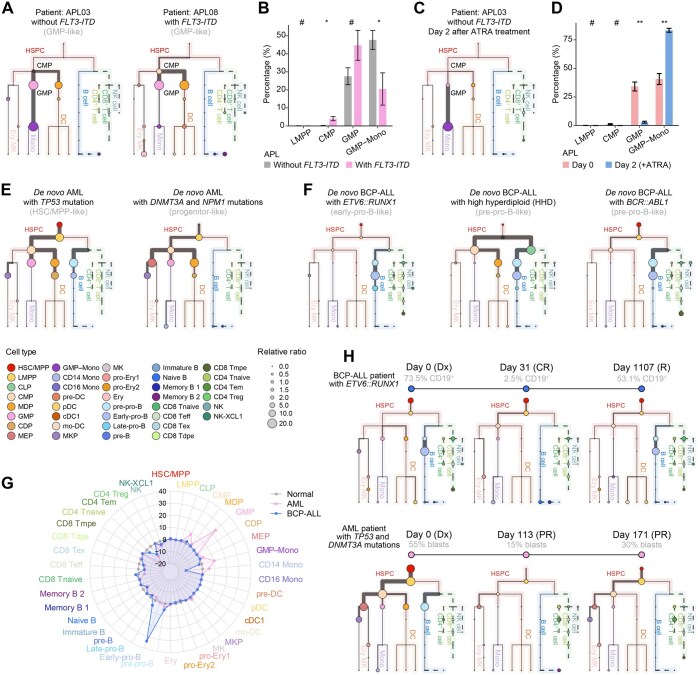
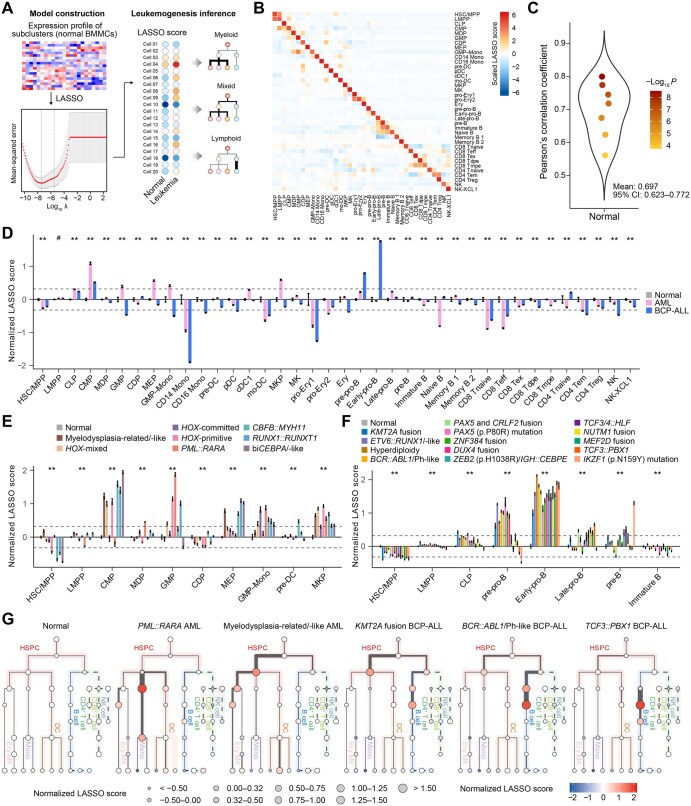
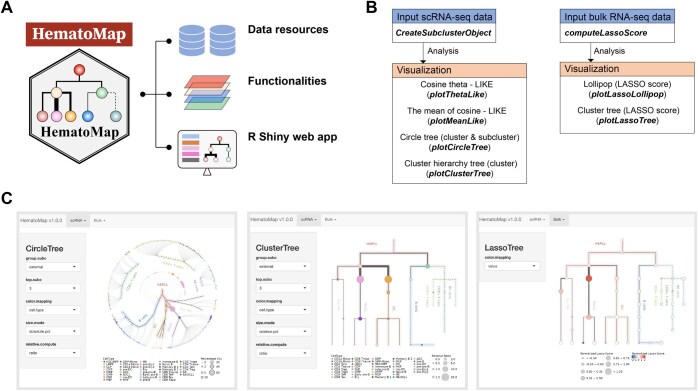
Precise mapping of leukemic cells onto the known hematopoietic hierarchy is important for understanding the cell-of-origin and mechanisms underlying disease initiation and development. However, this task remains challenging because of the high interpatient and intrapatient heterogeneity of leukemia cell clones as well as the differences that exist between leukemic and normal hematopoietic cells. Using single-cell RNA sequencing (scRNA-seq) data with a curated clustering approach, we constructed a comprehensive reference hierarchy of normal hematopoiesis. This reference hierarchy was accomplished through multistep clustering and annotating over 100,000 bone marrow mononuclear cells derived from 25 healthy donors. We further employed the cosine distance algorithm to develop a likelihood score to determine the similarities of leukemic cells to their putative normal counterparts. Using our scoring strategies, we mapped the cells of acute myeloid leukemia (AML) and B cell precursor acute lymphoblastic leukemia (BCP-ALL) samples to their corresponding counterparts. The reference hierarchy also facilitated bulk RNA sequencing (RNA-seq) analysis, enabling the development of a least absolute shrinkage and selection operator (LASSO) score model to reveal subtle differences in lineage aberrancy within AML or BCP-ALL patients. To facilitate interpretation and application, we established an R-based package (HematoMap) that offers a fast, convenient, and user-friendly tool for identifying and visualizing lineage aberrations in leukemia from scRNA-seq and bulk RNA-seq data. Our tool provides curated resources and data analytics for understanding leukemogenesis, with the potential to enhance leukemia risk stratification and personalized treatments. The HematoMap is available at https://github.com/NRCTM-bioinfo/HematoMap.

Keywords: Acute leukemia; Bioinformatics; Hematopoietic hierarchy; Lineage aberration; Single-cell RNA sequencing.


Conflict of interest statement

The authors have declared no competing interests.

Figures

Graphical Abstract
Graphical Abstract
Figure 1
Figure 1
Workflow overview for resolving cell types in normal human BMMCs based on the well-established hematopoietic hierarchy A. Overview of the study design. The left panel shows a schematic representation of normal (upper) and abnormal (lower, the origin of acute leukemia) hematopoiesis. The bone marrow microenvironment is a cellular system consisting of various cell lineages, including immature cells such as HSPCs and mature cells such as monocytes. In this study, we first used 25 scRNA-seq datasets of normal BMMCs (10X Genomics) to perform hierarchy-based annotation. To support this application, we constructed a normal reference of BMMCs to infer the aberrancy of leukemic blasts and altered differentiation lineages on BCP-ALL and AML scRNA-seq and bulk RNA-seq. All of these can be performed in our newly developed R-based package HematoMap to support further leukemic research. B. Dot plot of markers of different cell types (38 main cell types and 4 cycling cell types) in normal BMMCs. C. Characterization of the cell types identified from the 25 normal BMMC samples. UMAP was used for dimensionality reduction and visualization. For the left panel, dots represent cells (the single-cell level). For the middle panel, dots represent subclusters (the subcluster level). For the right panel, dots represent cell types (the cell-type level). The different colors indicate different cell types. The coordinates of subclusters/cell types were calculated using the mean value of the included cells. For visualization at the cell-type level, the continuous differentiation was labeled with a black line. HSCs/MPPs are at the differentiation initiation site. D. Hierarchy-based visualization of normal hematopoiesis. The inner circle shows the 38 major cell types identified in normal BMMCs, with the subclusters of each cell type being arranged around the circle’s edge. The solid lines represent continuous differentiation (HSPCs, monocytes, erythrocytes, and B cell lineage), the dashed lines represent recruited mature cells from other tissues (T/NK cells and some memory B cells), and the gray lines represent links between each cell type and its subclusters. The cell types, represented as circles, are color-coded. E. Annotation accuracy comparing annotation using SingleR (the subclusters obtained from the 25 normal BMMC samples were input as the reference) and manual annotation using classical markers. The annotation accuracy of each cell population was visualized using a box plot, with the mean value and 95% CI illustrated. F. ROC curve and AUC analyses revealed high sensitivity and specificity and favorable performance when the annotation reference constructed from the 25 normal BMMC samples was used. HSPC, hematopoietic stem/progenitor cell; scRNA-seq, single-cell RNA sequencing; BMMC, bone marrow mononuclear cell; BCP-ALL, B cell precursor acute lymphoblastic leukemia; AML, acute myeloid leukemia; RNA-seq, RNA sequencing; UMAP, Uniform Manifold Approximation and Projection; ROC, receiver operating characteristic; AUC, area under the curve; CI, confidence interval; FPR, false positive rate; TPR, true positive rate; HSC/MPP, hematopoietic stem cell/multipotent progenitor; LMPP, lymphoid-primed multipotent progenitor; CLP, common lymphoid progenitor; CMP, common myeloid progenitor; MDP, monocyte–dendritic cell progenitor; GMP, granulocyte–monocyte progenitor; CDP, common dendritic cell progenitor; MEP, megakaryocyte–erythrocyte progenitor; Mono, monocyte; GMP–Mono, GMP–monocyte; CD14 Mono, classical (CD14+CD16) monocyte; CD16 Mono, non-classical (CD14CD16+) monocyte; DC, dendritic cell; pre-DC, dendritic cell precursor; pDC, plasmacytoid dendritic cell; cDC1, conventional dendritic cell 1; mo-DC, monocyte-derived dendritic cell; MKP, megakaryocyte progenitor; MK, megakaryocyte; pro-Ery1, proerythroblast 1; pro-Ery2, proerythroblast 2; Ery, erythroblast; pre-pro-B, B cell progenitor precursor; Early-pro-B, early B cell progenitor; early-pro-B cyc., early cycling B cell progenitor; Late-pro-B, late B cell progenitor; late-pro-B cyc., late cycling B cell progenitor; pre-B, B cell precursor; Immature B, immature B cell; Naive B, naive B cell; Memory B 1, memory B cell 1; Memory B 2, memory B cell 2; CD8 Tnaive, naive CD8+ T cell; CD8 Tdpe, KLRG1+IL7R+ double-positive effector CD8+ T cell; CD8 Tmpe, memory precursor effector CD8+ T cell; CD8 Teff, effector CD8+ T cell; CD8 Tex, exhausted CD8+ T cell; CD4 Tnaive, naive CD4+ T cell; CD4 Tem, effector memory CD4+ T cell; CD4 Treg, regulatory T cell; NK, natural killer cell; NK-XCL1, XCL1+ natural killer cell; NK cyc., cycling natural killer cell; NK/T cyc., cycling natural killer/T cell.
Figure 2
Figure 2
Estimation of similarities between leukemic blasts and lineage aberrancy inference from scRNA-seq data in a de novo APL patient A. Illustration of the algorithm used to calculate the LIKE score. The distance d() between subclusters is defined using the cosine similarity distance, which acts as a metric to compare gene expression profile vectors between leukemia-associated subclusters (matrix A) and reference subclusters consisting of normal BMMCs (matrix B) and HSC/MPP subclusters (matrix C). The LIKE score for each leukemia-related subcluster is derived from these cosine similarity calculations, which quantify the extent to which each leukemia subcluster resembles the gene expression patterns of the normal BMMC subclusters. B. Hierarchy-based visualization of the cellular composition of de novo APL. The inner circle shows the 38 major cell types identified in normal BMMCs, and the subclusters in each cell type are arranged around the edge of the circle. The solid lines represent continuous differentiation (HSPCs, monocytes, DCs, erythrocytes, and B cell lineage), the dotted lines represent recruited mature cells from other tissues (T/NK cells and some memory B cells), and the gray lines represent links between each cell type and its subclusters. Dots are color-coded by cell type. C. Tree plot visualization of the lineages of normal BMMCs (left) and APL BMMCs (right). The cell types, represented as circles, are color-coded, with HSC/MPP sitting at the initiation site of the hierarchy. The size of the circle represents the relative ratio of cell proportions in leukemic (e.g., APL)/normal (reference) BMMCs. A relative ratio > 1 represents proliferation, whereas a ratio < 1 represents suppression. The aberrant lineages in APL are indicated by thicker lines. The solid lines depict continuous differentiation processes within bone marrow hematopoiesis, and the dashed lines denote cells recruited into the bone marrow from other tissues, such as T and NK cells. APL, acute promyelocytic leukemia; LIKE score, likelihood score.
Figure 3
Figure 3
Inference of leukemic aberrant lineages in the AML and BCP-ALL scRNA-seq cohorts A. Tree plots displaying the aberrant lineages in two de novo APL patients (AML with PML::RARA fusion). The first patient (APL03) did not carry the FLT3-ITD mutation, whereas the second patient (APL08) did. The circle size represents the ratio of the total number of cells to the total number of normal BMMCs (the relative ratio). The thickness of the line indicates the proportion of cells within that lineage. B. Box plot revealing the estimated percentages of the cell populations in 16 APL patients (n = 11 for APL patients without the FLT3-ITD mutation and n = 5 for APL patients with the FLT3-ITD mutation). The percentages of cells were estimated via HematoMap. P values were calculated via the Mann–Whitney U test (#, P ≥ 0.05; *, P < 0.05; **, P < 0.01). C. Tree plot of the APL patient (APL03) after two days of ATRA treatment. D. Box plot revealing the estimated percentages of the cell populations in 3 APL patients on Day 0 and after two days of ATRA treatment (Day 2). P values were calculated using the paired Mann–Whitney U test (#, P ≥ 0.05; *, P < 0.05; **, P < 0.01). E. Tree plots displaying the aberrant lineages in the two de novo AML patients from scDS4. The first patient, harboring the TP53 mutation, was validated to be HSC-like via flow cytometry in a previous study (Patient AML916). DNMT3A and NPM1 mutations were detected in the second AML patient from scDS4, and the patient was reported to be progenitor-like (Patient AML419). The thickness of the line indicates the proportion of cells within that lineage. F. Tree plots displaying the aberrant lineages of the three de novo BCP-ALL patients from scDS1 (scRNA-seq, 10X Genomics) and scDS2 (scRNA-seq, 10X Genomics). Aberrations in B cell lineages occurred in BCP-ALL patients with ETV6::RUNX1 and BCR::ABL1, whereas in highly hyperdiploid BCP-ALL patients, aberrations occurred in both CMP and CLP cells. G. Radar plot of changes in the cellular composition of AML (pink line) and BCP-ALL (blue line) cells compared with normal BMMCs. H. Tree plots depicting changes in the aberrant lineages of two patients (one BCP-ALL patient harboring ETV6::RUNX1 and one AML patient harboring TP53 and DNMT3A mutations) during treatment. ATRA, all-trans retinoic acid; Dx, diagnosis; CR, complete remission; R, relapse; PR, partial remission.
Figure 4
Figure 4
Inference of leukemic aberrant lineages in the AML and BCP-ALL bulk cohorts A. Overview of the construction of the LASSO-based score model. B. Heatmap visualization of the LASSO score for each cell type via scRNA-seq data. LASSO scores were calculated based on the mean values of scores in each subcluster and normalized by the z-score. C. Violin plot of self-validation using the seven available normal BMMC samples with both scRNA-seq (10X Genomics) and bulk RNA-seq data. Pearson’s correlation coefficients were calculated between the LASSO scores from the scRNA-seq and bulk RNA-seq data. Each circle represents one sample. D. Bar plot of normalized scores in normal, AML, and BCP-ALL BMMCs from bulk RNA-seq data. Normalization was performed by subtracting the mean values of normal samples of each cell type. P values were calculated via ANOVA (#, P ≥ 0.05; *, P < 0.05; **, P < 0.01). E. Bar plot of the normalized scores from normal BMMCs and AML patients in different subgroups. P values were calculated via ANOVA (**, P < 0.01). F. Bar plot of the normalized scores from normal BMMCs and BCP-ALL patients in different subgroups. P values were calculated by ANOVA (**, P < 0.01). G. Tree plots depicting inferred lineage aberrations according to normalized LASSO scores of normal BMMCs and representative subgroups of AML and BCP-ALL patients. For myelodysplasia-related/-like AML patients, the aberrations started from HSC/MPP/LMPP and mainly influenced the myeloid lineages (for most AML patients). For BCP-ALL patients with KMT2A fusion, both the myeloid and lymphoid lineages were affected (for MPAL). For BCP-ALL patients with BCR::ABL1, the aberrations started from LMPP and mainly influenced the B cell lineage (for most BCP-ALL patients). For BCP-ALL patients with TCF3::PBX1, the alterations were mostly observed in pre-pro-B, early-pro-B, and late-pro-B lineages. The thickness of the line indicates the proportion of cells within that lineage. LASSO, least absolute shrinkage and selection operator; ANOVA, analysis of variance; MPAL, mixed phenotype acute leukemia.
Figure 5
Figure 5
Overview of the HematoMap package design, main functionalities, and analysis workflow A. Structure of the HematoMap package. B. Overview of the main functionalities in HematoMap. The headers of boxes describe available functional modules, including input and visualization. The brief descriptions and the corresponding functions are listed in module boxes. C. Snapshots of applications for the visualization of scRNA-seq and bulk RNA-seq data developed using the R Shiny package. The left panel shows the tool for visualizing the circle tree of the example scRNA-seq data (taking the APL sample as an example). The middle panel shows the visualization of the cluster tree. The right panel shows the tool for mapping the LASSO score of bulk RNA-seq data to the cluster tree.

Similar articles

Cited by

  • Biomedical Big Data and Artificial Intelligence in Blood.
    He F (和夫红), Zhang Z (张昭军), Fang X (方向东), Wang QF (王前飞). He F (和夫红), et al. Genomics Proteomics Bioinformatics. 2025 May 30;23(2):qzaf043. doi: 10.1093/gpbjnl/qzaf043. Genomics Proteomics Bioinformatics. 2025. PMID: 40314993 Free PMC article. No abstract available.

References

    1. DiNardo CD, Garcia-Manero G, Pierce S, Nazha A, Bueso-Ramos C, Jabbour E, et al. Interactions and relevance of blast percentage and treatment strategy among younger and older patients with acute myeloid leukemia (AML) and myelodysplastic syndrome (MDS). Am J Hematol 2016;91:227–32. - PMC - PubMed
    1. Shafat MS, Oellerich T, Mohr S, Robinson SD, Edwards DR, Marlein CR, et al. Leukemic blasts program bone marrow adipocytes to generate a protumoral microenvironment. Blood 2017;129:1320–32. - PubMed
    1. Arber DA, Orazi A, Hasserjian R, Thiele J, Borowitz MJ, Le Beau MM, et al. The 2016 revision to the World Health Organization classification of myeloid neoplasms and acute leukemia. Blood 2016;127:2391–405. - PubMed
    1. Alexander TB, Gu Z, Iacobucci I, Dickerson K, Choi JK, Xu B, et al. The genetic basis and cell of origin of mixed phenotype acute leukaemia. Nature 2018;562:373–9. - PMC - PubMed
    1. Pagliaro L, Chen SJ, Herranz D, Mecucci C, Harrison CJ, Mullighan CG, et al. Acute lymphoblastic leukaemia. Nat Rev Dis Primers 2024;10:41. - PubMed

LinkOut - more resources