

Decomposing delta plots: exploring the time course of the congruency effect using inhibition and facilitation curves
- PMID: 39945908
- PMCID: PMC11825566
- DOI: 10.1007/s00426-024-02075-z
Decomposing delta plots: exploring the time course of the congruency effect using inhibition and facilitation curves
Abstract
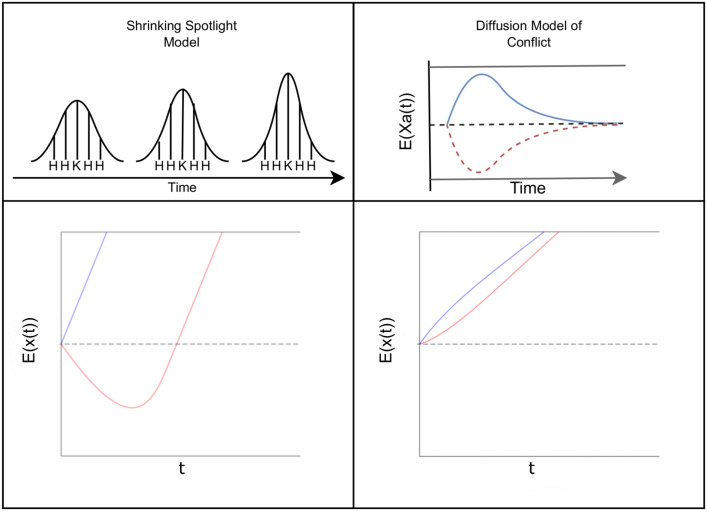
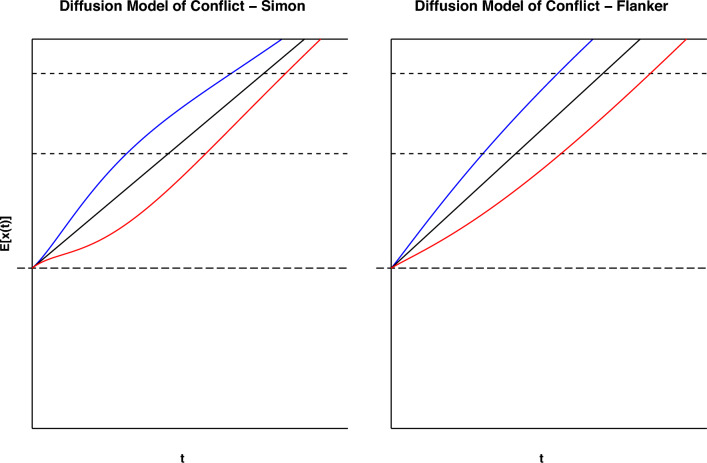
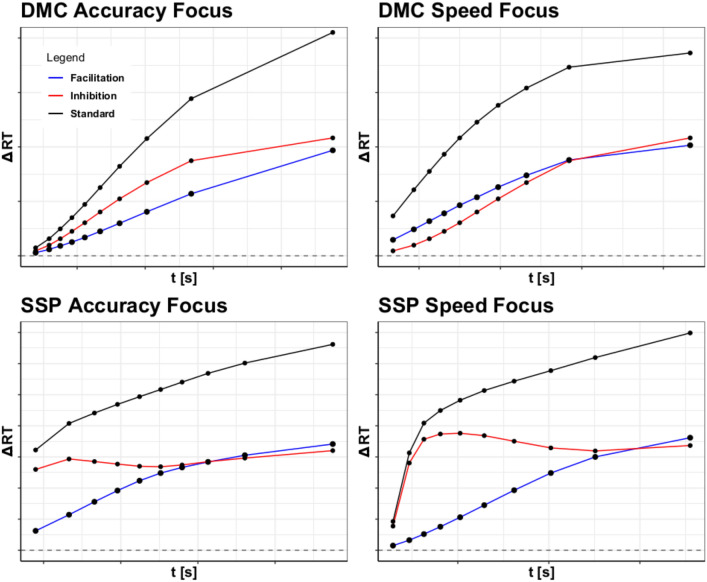
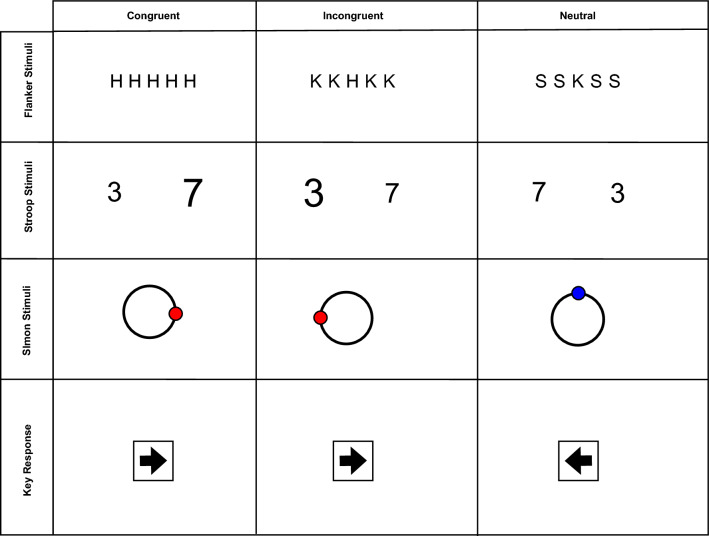
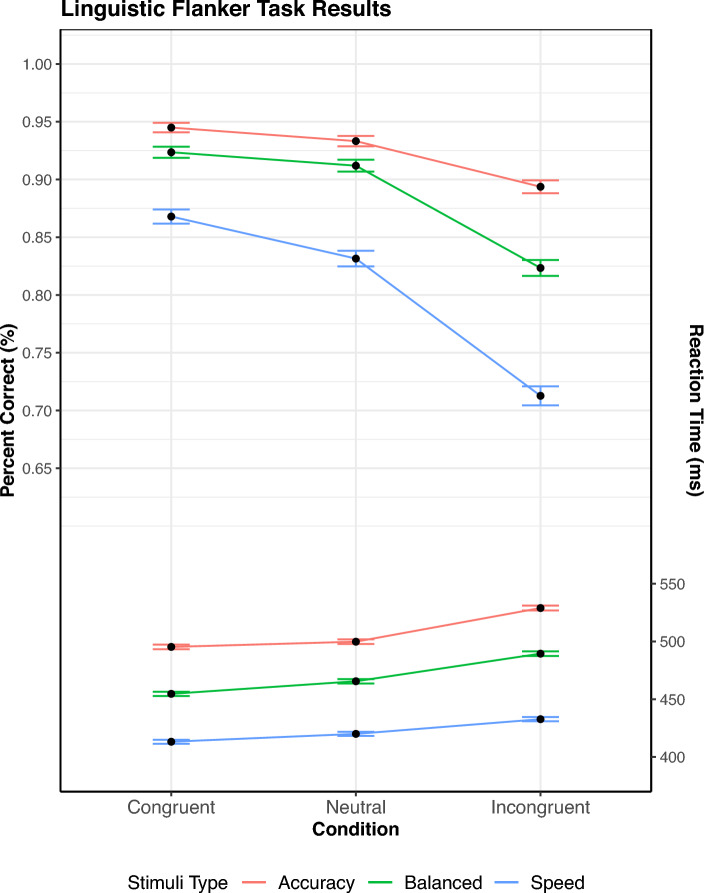
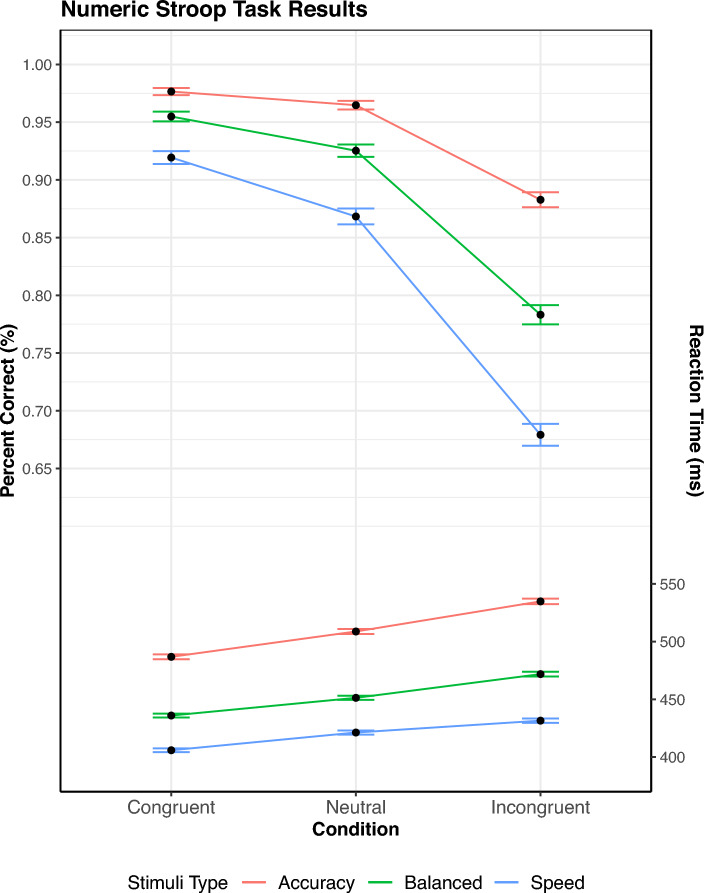
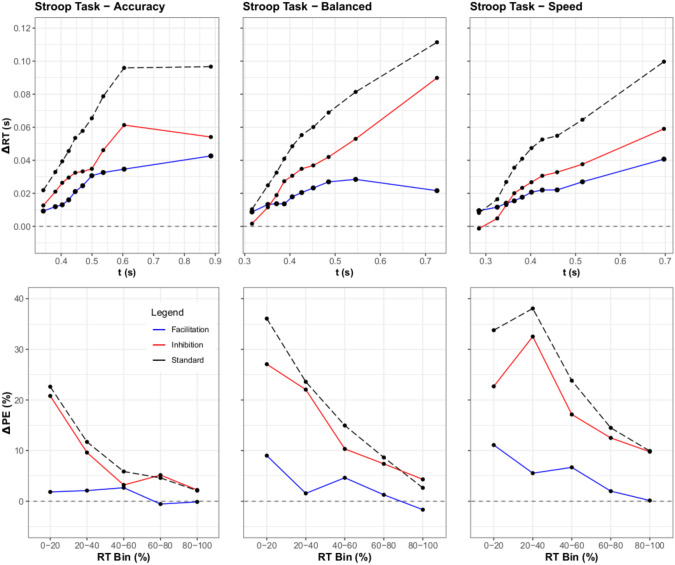
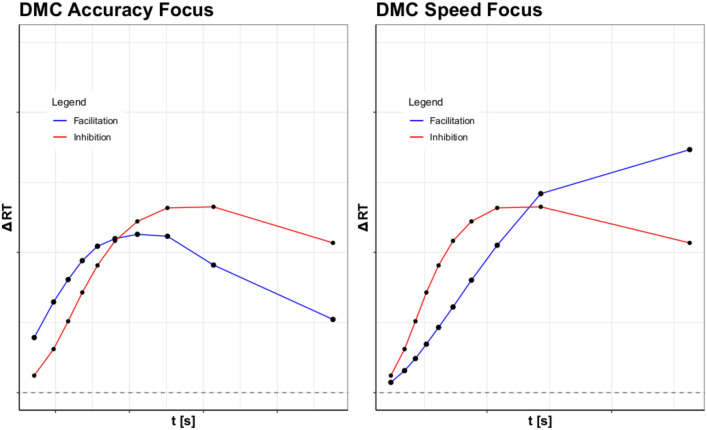
When assessing the time-course of evidence accrual in conflict tasks, delta plots are often employed to show the time course of congruency effects. However, delta plots on reaction time and response errors only capture the differences between the congruent and incongruent conditions, detailing that a pattern or shift is occurring, but not what contributes to creating these changes. To gain a clearer idea of what is causing these trends and shifts, the neutral condition can be added to conflict tasks in order to decompose the congruency effect into two components: facilitation and inhibition. Similarly, the traditional delta plot of the congruency effect can also be decomposed to capture the time-course of facilitation and inhibition in separate curves. Thus, this article endeavored to both assess the utility of inhibition and facilitation curves as a tool for parsing apart the congruency effect, and also to see how the observed patterns changed on a larger time frame. To do this, an exploratory study was conducted on three conflict task experiments (a linguistic flanker task, numeric Stroop task, and symbolic Simon task) that were run with a speed-accuracy tradeoff measure implemented as well. By observing the conflict tasks at various speed stresses, we hoped to evaluate how, or if, inhibition and facilitation change at different response thresholds. The addition of delta functions for facilitation and inhibition provided further insight into base mean RT data. The results also provided evidence for numerous assumptions regarding cognitive control, such as a dominant effect of inhibition driving most of the congruency effect.
© 2025. The Author(s).
Conflict of interest statement
Declarations. Conflict of interest: The researchers have no known Conflict of interest, or reason to influence the results Ethical approval: Not applicable Consent to participate: All participants gave appropriate consent in the collection of their data and participation in the experiment. Consent for publication: All participants consented to the use and potential publication of their anonymized data and the results of any analysis of said data Code availability: Not Applicable
Figures


Similar articles
-
Dissociation between reaction time and pupil dilation in the Stroop task.J Exp Psychol Learn Mem Cogn. 2019 Oct;45(10):1899-1909. doi: 10.1037/xlm0000690. Epub 2019 Feb 28. J Exp Psychol Learn Mem Cogn. 2019. PMID: 30816765
-
Sequential conflict resolution under multiple concurrent conflicts: An ERP study.Neuroimage. 2019 Mar;188:411-418. doi: 10.1016/j.neuroimage.2018.12.031. Epub 2018 Dec 15. Neuroimage. 2019. PMID: 30562575
-
The time-course of distractor-based activation modulates effects of speed-accuracy tradeoffs in conflict tasks.Psychon Bull Rev. 2022 Jun;29(3):837-854. doi: 10.3758/s13423-021-02003-x. Epub 2021 Dec 16. Psychon Bull Rev. 2022. PMID: 34918279 Free PMC article.
-
A diffusion model for the congruency sequence effect.Psychon Bull Rev. 2022 Dec;29(6):2034-2051. doi: 10.3758/s13423-022-02119-8. Epub 2022 Jun 8. Psychon Bull Rev. 2022. PMID: 35676612 Review.
-
A comment on the Revised Diffusion Model for Conflict tasks (RDMC).Psychon Bull Rev. 2025 Apr;32(2):690-704. doi: 10.3758/s13423-024-02574-5. Epub 2024 Oct 24. Psychon Bull Rev. 2025. PMID: 39448516 Free PMC article. Review.
References
-
- Cohen, J. D. (2017). Cognitive control: Core constructs and current considerations (pp. 1–28). The Wiley Handbook of Cognitive Control.
-
- de Jong, R., Liang, C. C., & Lauber, E. (1994). Conditional and unconditional automaticity: A dual-process model of effects of spatial stimulus-response correspondence. Journal of Experimental Psychology: Human Perception & Performance,20, 731–750. - PubMed
-
- Ellinghaus, R., Karlbauer, M., Bausenhart, K. M., & Ulrich, R. (2018). On the time-course of automatic response activation in the Simon task. Psychological Research,82, 734–743. - PubMed
-
- Eriksen, B. A., & Eriksen, C. W. (1974). Effects of noise letters upon the identification of a target letter in a nonsearch task. Perception, & Psychophysics,16, 143–149.
MeSH terms
LinkOut - more resources
Full Text Sources
