. 2025 Feb 13;16(1):171.
doi: 10.1007/s12672-025-01952-2.

Identification and characterization of cuproptosis related gene subtypes through multi-omics bioinformatics analysis in breast cancer

Affiliations

Identification and characterization of cuproptosis related gene subtypes through multi-omics bioinformatics analysis in breast cancer

Dalang Fang et al. Discov Oncol. .

Abstract

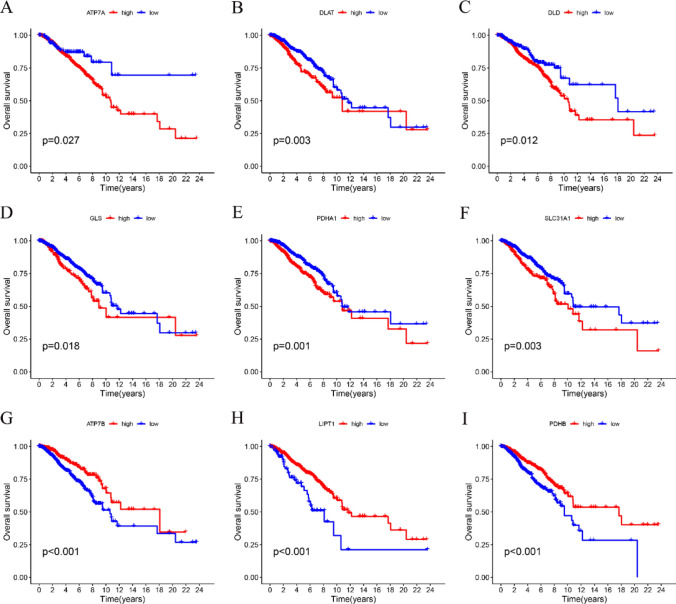
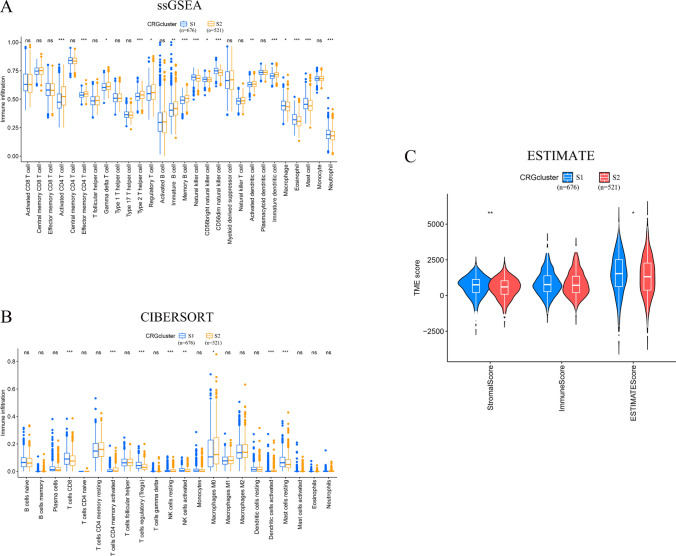
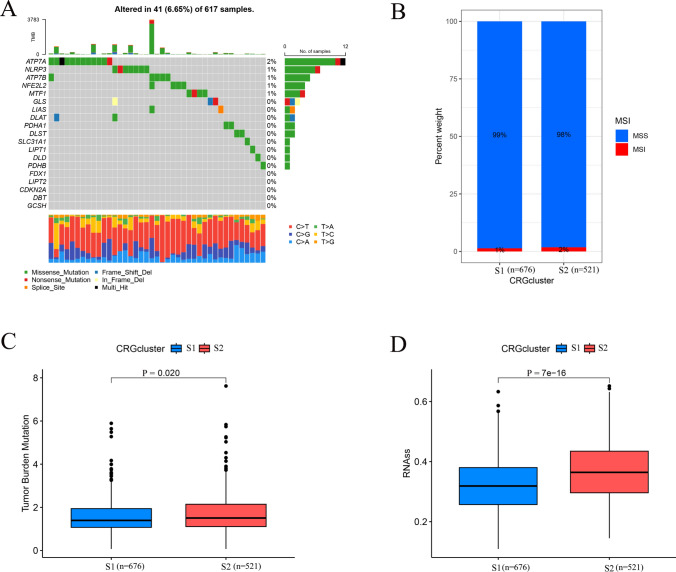
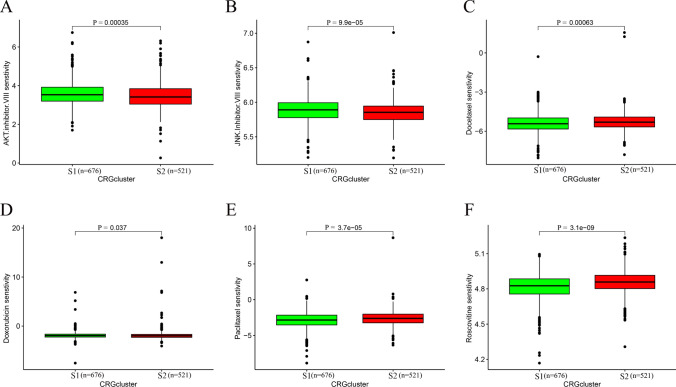
Cuproptosis, a newly suggested mechanism of controlled cellular demise, which has been extensively associated with aspects of occurrence and development in breast cancer. The aim of this study was to conduct a comprehensive multi-group bioinformatics analysis based on the expression of cuproptosis-related genes (CRGs) to identify novel breast cancer subtypes to guide clinical practice. We collected TCGA-BRCA and GSE42568 datasets to investigate the expression patterns of CRGs in breast cancer. Consensus cluster analysis was performed to identify distinct subtypes. Subsequently, an investigation was carried out to examine the disparities between CRGclusters through functional enrichment analysis. Finally, we examined microsatellite instability, tumor mutation burden, drug sensitivity, infiltration of immune cells and cancer cell stemness across different CRGclusters. We identified two subtypes, where CRGcluster S2 exhibits a poorer prognosis compared to CRGcluster S1. Moreover, CRGcluster S2 demonstrated lower immune infiltration scores, higher cancer cell stemness index, and increased tumor mutation burden relative to CRGcluster S1, with the most frequently mutated gene being ATP7A. Notably, breast cancer chemotherapy drugs such as docetaxel, doxorubicin, and paclitaxel exhibited reduced sensitivity towards CRGcluster S2 when compared to CRGcluster S1. We have identified two CRGclusters in breast cancer that could serve as potential therapeutic targets and warrant further investigation in clinical trial studies for breast cancer.

Keywords: Bioinformatics; Breast cancer; Cuproptosis; Drug sensitivity; Multi-omics.


Conflict of interest statement

Declarations. Ethics approval and consent to participate: The samples utilized in this study were obtained from publicly available online databases, thus exempting the need for ethical approval. Consent for publication: Not applicable. Competing interests: The authors declare no competing interests.

Figures

Fig. 1
Fig. 1
Comparison of CRGs expression levels in breast cancer tumor tissues and normal tissues was conducted using box plots in TCGA and GEO cohorts. A Boxplot of CRGs expression levels in the TCGA cohort; B Boxplot of CRGs expression levels in the GEO cohort. The horizontal line in the box plot represents the median value of gene expression
Fig. 2
Fig. 2
Results of univariate Cox survival analysis of CRGs for the merged cohort and correlation analysis between expression levels of CRGs
Fig. 3
Fig. 3
Kaplan–Meier survival analysis between the CRGs expression levels and breast cancer prognosis (OS) in the merge cohort. A ATP7A; B DLAT; C DLD; D GLS; E PDHA1; FF SLC31A1; G ATP7B; H LIPT1; I PDHB. CRGs, cuproptosis related genes
Fig. 4
Fig. 4
Consensus cluster analysis was used to identify novel CRGclusters of breast cancer, and principal component analysis and prognostic analysis were performed between clusters A Consistent clustering analysis diagram based on CRGs; B Delta area diagram; C Consensus cumulative distribution function diagram; D Principal component analysis of CRGcluster S1 and B; E Survival analysis of CRGcluster S1 and S2
Fig. 5
Fig. 5
Differentially expressed genes between CRGclusters and differentially expressed CRGs between CRGclusters. A Volcanoplot of DEGs; B Boxdiagram of the relationship between CRGs expression level and CRGclusters; The horizontal line in the box plot represents the median value of gene expression
Fig. 6
Fig. 6
Conducting functional enrichment analysis (GO and KEGG) of DEGs in CRGclusters. A Barplot of the GO analysis; B Circular illustrating diagram the top 6 BP, CC, MF; C Barplot of the KEGG analysis; D Circular illustrating diagram of the KEGG signaling pathways
Fig. 7
Fig. 7
The ssGSEA, CIBERSORT and ESTIMATE analysis of immune infiltration among CRGclusters in breast cancer. A Box plots were generated utilizing the ssGSEA algorithm to evaluate variations in immune cell levels across CRGclusters; B The CRGclusters were analyzed using the CIBERSORT methods to evaluate variations in immune cell abundance, which were visualized through box plots; C Violin plots were employed for the purpose of visualizing the variation in immune infiltration scores between CRGclusters based on the ESTIMATE algorithm. CRGs, cuproptosis related genes. In box plots or violin plots, the horizontal line denotes the median of the immune infiltration level
Fig. 8
Fig. 8
The relationship between CRGclusters and TMB, MSI and RNAss in breast cancer. A Waterfall plot of gene mutations for the 19 CRGs; B Boxplot of MSI proportions between cluster S1 and S2; C Boxplot of TMB between clusters S1 and S2; D Boxplot of RNAss between cluster S1 and S2
Fig. 9
Fig. 9
The drug sensitivity of CRGclusters was predicted based on the gene expression matrix in breast cancer. A AKT.inhibitor.VIII; B JNK.Inhibitor.VIII; C Docetaxel; D Doxorubicin; E Paclitaxel; F Roscovitine. CRGs, cuproptosis related genes

Similar articles

Cited by

References

    1. da Costa Nunes GG, de Freitas LM, Monte N, Gellen LPA, Santos AP, de Moraes FCA, da Costa ACA, de Lima MC, Fernandes MR, Dos Santos SEB, et al. Genomic variants and worldwide epidemiology of breast cancer: a genome-wide association studies correlation analysis. Genes. 2024. 10.3390/genes15020145. - PMC - PubMed
    1. Sung H, Ferlay J, Siegel RL, Laversanne M, Soerjomataram I, Jemal A, Bray F. Global cancer statistics 2020: GLOBOCAN estimates of incidence and mortality worldwide for 36 Cancers in 185 Countries. CA Cancer J Clin. 2021;71:209–49. - PubMed
    1. Gradishar WJ, Moran MS, Abraham J, Abramson V, Aft R, Agnese D, Allison KH, Anderson B, Burstein HJ, Chew H, et al. NCCN Guidelines(R) insights: breast cancer, version 4.2023. J Natl Compr Canc Netw. 2023;21:594–608. - PubMed
    1. Ye F, Dewanjee S, Li Y, Jha NK, Chen ZS, Kumar A, Vishakha Behl T, Jha SK, Tang H. Advancements in clinical aspects of targeted therapy and immunotherapy in breast cancer. Mol Cancer. 2023;22:105. - PMC - PubMed
    1. Raman D, Cimpean AM, De Miglio MR. Editorial: drug resistance in breast cancer - mechanisms and approaches to overcome chemoresistance. Front Oncol. 2022;12:1080684. - PMC - PubMed

LinkOut - more resources