

On people's perceptions of climate change and its impacts in a hotspot of global warming
- PMID: 39946319
- PMCID: PMC11825050
- DOI: 10.1371/journal.pone.0317786
On people's perceptions of climate change and its impacts in a hotspot of global warming
Erratum in
-
Correction: On people's perceptions of climate change and its impacts in a hotspot of global warming.PLoS One. 2025 Apr 30;20(4):e0323273. doi: 10.1371/journal.pone.0323273. eCollection 2025. PLoS One. 2025. PMID: 40305567 Free PMC article.
Abstract
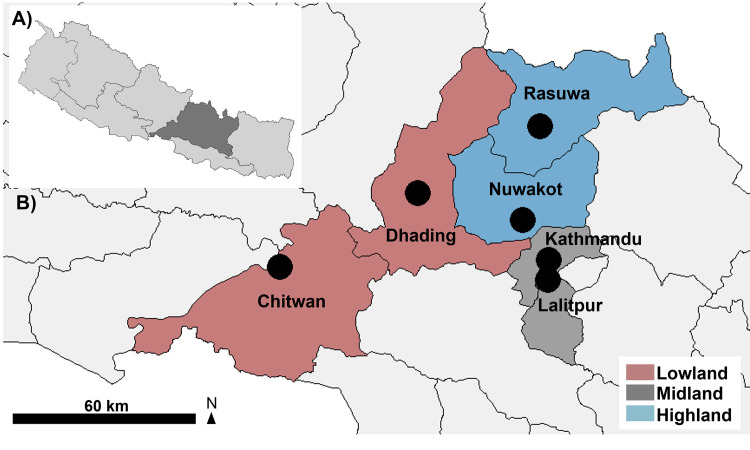
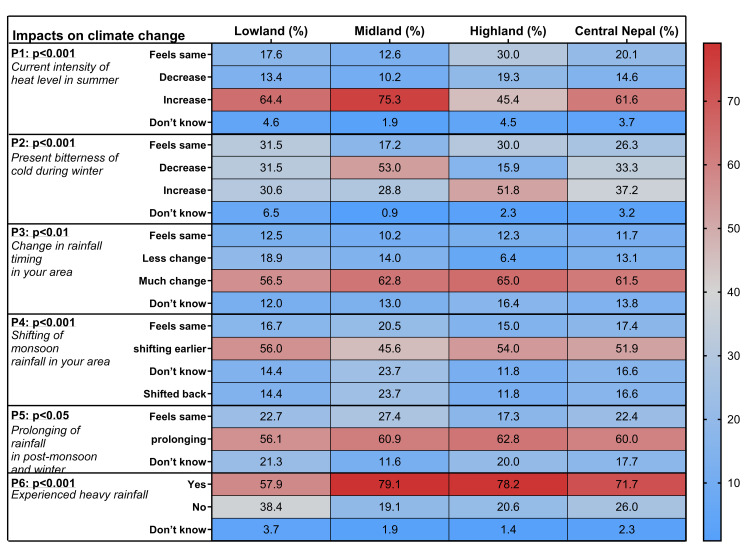
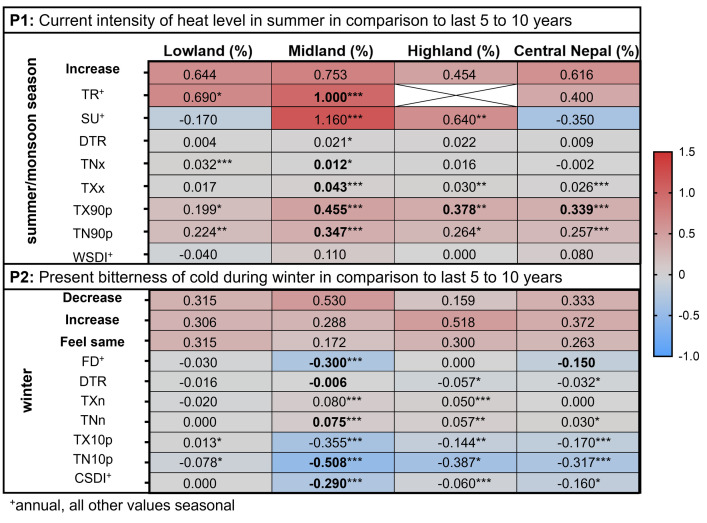
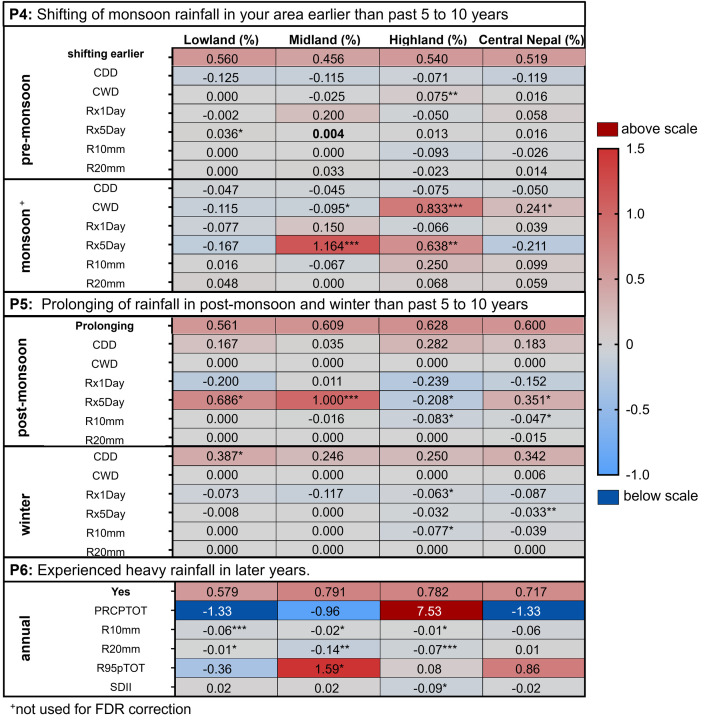
The Hindu Kush Himalayan region is a global hotspot for climate change and highly vulnerable to its direct and indirect impacts. Understanding people's perception of climate change is crucial for effective adaptation strategies. We conducted a study by using quantitative (Household survey, n = 660) and qualitative data collection tools (Focus group discussion, n = 12; In-depth interviews, n = 27) in central Nepal encompassing three altitudinal regions: Lowland (<1000 m amsl; Terai region), Midland (1000-1500 m amsl; hilly region) and Highland (1500-2100 m amsl; mountainous region). We analyzed 37 years (1981-2017) of climatic data from respective districts (Lowland: Chitwan, Dhading; Midland: Kathmandu, Lalitpur; Highland: Nuwakot, Rasuwa). People's perception was compared with climate extreme indices measured along these regions and evaluated if they accurately recognized the impacts on the environment and human health. Our findings show significant climate changes, including rising summer temperature, region-specific winter temperatures and extended monsoon seasons in Nepal. Participants in our study accurately perceived these trends but misperceived heavy precipitation patterns. Reported impacts are rise in crop diseases, human diseases, vector expansion and climate induced disasters like floods, landslides, and water resource depletion, with perception accuracy varying by region. These insights highlight the importance of understanding regional and cross-regional perceptions in relation to climate data in order to develop tailored climate adaptation strategies. Policymakers can use this information to establish region-specific educational and communication initiatives, addressing communities' distinctive vulnerabilities and needs across diverse landscapes. Such approaches can enhance equitable and effective climate resilience in subtropical to alpine regions.
Copyright: © 2025 Phuyal et al. This is an open access article distributed under the terms of the Creative Commons Attribution License, which permits unrestricted use, distribution, and reproduction in any medium, provided the original author and source are credited.
Conflict of interest statement
The authors have declared that no competing interests exist.
Figures
Similar articles
-
The 2023 Latin America report of the Lancet Countdown on health and climate change: the imperative for health-centred climate-resilient development.Lancet Reg Health Am. 2024 Apr 23;33:100746. doi: 10.1016/j.lana.2024.100746. eCollection 2024 May. Lancet Reg Health Am. 2024. PMID: 38800647 Free PMC article. Review.
-
Effect of meteorological factors on the seasonal prevalence of dengue vectors in upland hilly and lowland Terai regions of Nepal.Parasit Vectors. 2019 Jan 18;12(1):42. doi: 10.1186/s13071-019-3304-3. Parasit Vectors. 2019. PMID: 30658693 Free PMC article.
-
Impact of Climate Change on Health and Well-Being of People in Hindu Kush Himalayan Region: A Narrative Review.Front Physiol. 2021 Aug 6;12:651189. doi: 10.3389/fphys.2021.651189. eCollection 2021. Front Physiol. 2021. PMID: 34421631 Free PMC article. Review.
-
Climate warming modifies hydrological responses in the southern Western Ghats and the western coastal plains (India): Insights from CMIP6-VIC simulations.J Environ Manage. 2025 May;381:125252. doi: 10.1016/j.jenvman.2025.125252. Epub 2025 Apr 6. J Environ Manage. 2025. PMID: 40194499
-
Perception of Climate Change Vulnerability and its Impact on Sexual and Reproductive Health and Rights in Khutiya and Banganga River Basins.J Nepal Health Res Counc. 2024 Jun 21;22(1):25-33. doi: 10.33314/jnhrc.v22i01.4940. J Nepal Health Res Counc. 2024. PMID: 39080933
Cited by
-
Correction: On people's perceptions of climate change and its impacts in a hotspot of global warming.PLoS One. 2025 Apr 30;20(4):e0323273. doi: 10.1371/journal.pone.0323273. eCollection 2025. PLoS One. 2025. PMID: 40305567 Free PMC article.
References
-
- IPCC. Climate Change 2014-Impacts, Adaptation, and Vulnerability: Regional Aspects. Barros VR, AField CB, Dokken DJ, Mastrandrea MD, Mach KJ, Bilir TE, et al.., editors. Quarterly Journal of Economics. Cambridge, United Kingdom and New York: Cambridge University Press,; 2014. doi: 10.2307/1881805 - DOI
-
- Robinson S ann. Climate change adaptation in SIDS: A systematic review of the literature pre and post the IPCC Fifth Assessment Report. Wiley Interdiscip Rev Clim Chang. 2020;11: 1–21. doi: 10.1002/wcc.653 - DOI
-
- RANKOANA S. A Review of Rural Communities’ Vulnerability to Climate Change: The Case of Limpopo Province in South Africa. Int J Environ Sustain Soc Sci. 2023;4: 1742–1754. doi: 10.38142/ijesss.v4i6.722 - DOI
-
- Aliaga-Samanez A, Romero D, Murray K, Cobos-Mayo M, Segura M, Real R, et al.. Climate change is aggravating dengue and yellow fever transmission risk. Ecography (Cop). 2024; 1–9. doi: 10.1111/ecog.06942 - DOI
MeSH terms
LinkOut - more resources
Full Text Sources
Medical
