. 2025 Feb 13;21(2):e1012773.
doi: 10.1371/journal.pcbi.1012773. eCollection 2025 Feb.

AWGE-ESPCA: An edge sparse PCA model based on adaptive noise elimination regularization and weighted gene network for Hermetia illucens genomic data analysis

Affiliations

AWGE-ESPCA: An edge sparse PCA model based on adaptive noise elimination regularization and weighted gene network for Hermetia illucens genomic data analysis

Rui Miao et al. PLoS Comput Biol. .

Abstract

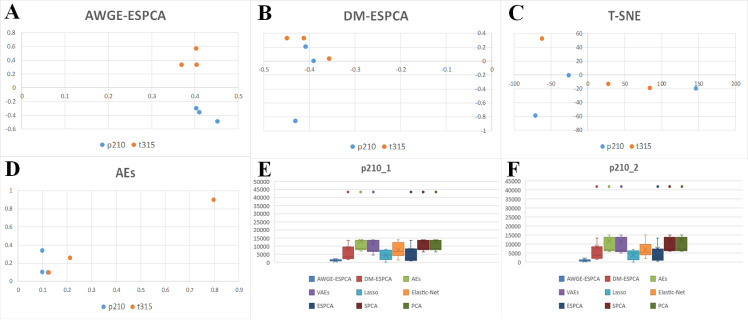
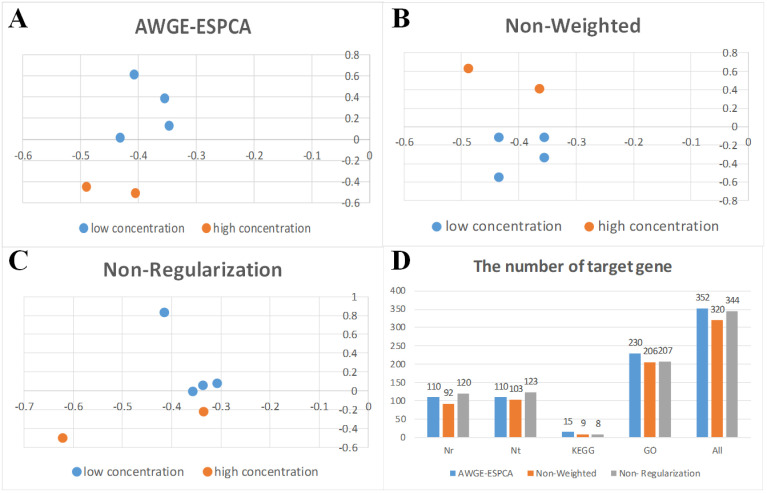
Hermetia illucens is an important insect resource. Studies have shown that exploring the effects of Cu2+-stressed on the growth and development of the Hermetia illucens genome holds significant scientific importance. There are three major challenges in the current studies of Hermetia illucens genomic data analysis: firstly, the lack of available genomic data which limits researchers in Hermetia illucens genomic data analysis. Secondly, to the best of our knowledge, there are no Artificial Intelligence (AI) feature selection models designed specifically for Hermetia illucens genome. Unlike human genomic data, noise in Hermetia illucens data is a more serious problem. Third, how to choose those genes located in the pathway enrichment region. Existing models assume that each gene probe has the same priori weight. However, researchers usually pay more attention to gene probes which are in the pathway enrichment region. Based on the above challenges, we initially construct experiments and establish a new Cu2+-stressed Hermetia illucens growth genome dataset. Subsequently, we propose AWGE-ESPCA: an edge Sparse PCA model based on adaptive noise elimination regularization and weighted gene network. The AWGE-ESPCA model innovatively proposes an adaptive noise elimination regularization method, effectively addressing the noise challenge in Hermetia illucens genomic data. We also integrate the known gene-pathway quantitative information into the Sparse PCA(SPCA) framework as a priori knowledge, which allows the model to filter out the gene probes in pathway-rich regions as much as possible. Ultimately, this study conducts five independent experiments and compared four latest Sparse PCA models as well as representative supervised and unsupervised baseline models to validate the model performance. The experimental results demonstrate the superior pathway and gene selection capabilities of the AWGE-ESPCA model. Ablation experiments validate the role of the adaptive regularizer and network weighting module. To summarize, this paper presents an innovative unsupervised model for Hermetia illucens genome analysis, which can effectively help researchers identify potential biomarkers. In addition, we also provide a working AWGE - ESPCA model code in the address: https://github.com/yhyresearcher/AWGE_ESPCA.


Conflict of interest statement

The authors have declared that no competing interests exist.

Figures

Fig 1
Fig 1. The algorithm of the AWGE-ESPCA model.
The steps are as follows: (A) Input Data: It includes sample data and gene pathway data. (B) Data Processing: It involves two core modules. First, Adaptive Noise Elimination Regularization is used to eliminate noise; then, Weighted Gene Network is constructed. (C) Result Output: It obtains gene expression values with different weights.
Fig 2
Fig 2. Flow chart of the AWGE-ESPCA model.
Fig 2 shows the specific flow of the AWGE-ESPCA algorithm. First, randomly initialize v  and calculate u; then, identify LAR based on the modified regularizer and remove the data noise to get the new u˘; then, calculate the edge information based on the gene network and the weighted information; finally, retain the important genes and edge information based on the u˘ and edge information and continue to loop through the process based on the current result.
Fig 3
Fig 3. Heatmaps comparing different methods for sample classification.
(A) the result of the AWGE-ESPCA model. (B) the result of the DM-ESPCA model. (C) the result of the AEs model. (D) the result of the VAEs model. (E) the result of the Lasso model. (F) the result of the Elastic Net model. The columns represent different categories, namely: Cu_0_FPKM, Cu_75_FPKM, Cu_150_FPKM. The rows are samples, and the colors in the heatmap represent the gene expression values.
Fig 4
Fig 4. Sample distribution visualization and analysis results across different models.
(A) the score plots of the AWGE-ESPCA model. (B) the score plots of the DM-ESPCA model. (C) the score plots of the T-SNE model. (D) the score plots of the AEs model. (E) boxplots comparing gene expression levels under Cu_0_FPKM condition across different models. (F) The number of target pathway genes identified by each model.
Fig 5
Fig 5. Heatmaps comparing different methods for sample classification.
(A) the result of the AWGE-ESPCA model. (B) the result of the DM-ESPCA model. (C) the result of the AEs model. (D) the result of the VAEs model. (E) the result of the Lasso model. (F) the result of the Elastic Net model. The columns display two samples - P210 (P210_1, P210_2, P210_3) and T315 (T315_1, T315_2, T315_3). The rows display different genes.
Fig 6
Fig 6. Principal component score plots and boxplots of various models.
(A) The score plot of the AWGE-ESPCA model. (B) The score plot of the DM-ESPCA model. (C) The score plot of the T-SNE model. (D) The score plot of the AEs model. (E) The boxplot of the p210_1. (F) The boxplot of the p210_2.
Fig 7
Fig 7. Principal Component Score Plot and the proportion of target pathway genes.
(A) the result of the AWGE-ESPCA model. (B) the result of the Non-Regularization model. (C) the result of the Non-Weighted model. (D) the number of target pathway genes.
Fig 8
Fig 8. Boxplots.
(A) the result of the AWGE-ESPCA model. (B) the result of the Non- Regularization model. (C) the result of the Non-Weighted model.
Fig 9
Fig 9. Bio-enrichment analysis picture.
Bio-enrichment analysis revealing functional interactions across six MCODE modules, highlighting key pathways in cellular differentiation, neurogenesis, and morphogenesis with corresponding enrichment scores (p < 0.05).

References

    1. Kaczor M, Bulak P, Proc-Pietrycha K, Kirichenko-Babko M, Bieganowski A. The variety of applications of Hermetia illucens in industrial and agricultural areas-review. Biology (Basel). 2022;12(1):25. doi: 10.3390/biology12010025 - DOI - PMC - PubMed
    1. Triunfo M, Tafi E, Guarnieri A, Salvia R, Scieuzo C, Hahn T, et al.. Characterization of chitin and chitosan derived from Hermetia illucens, a further step in a circular economy process. Sci Rep. 2022;12(1):6613. doi: 10.1038/s41598-022-10423-5 - DOI - PMC - PubMed
    1. Zhan S, Fang G, Cai M, Kou Z, Xu J, Cao Y, et al.. Genomic landscape and genetic manipulation of the black soldier fly Hermetia illucens, a natural waste recycler. Cell Res. 2020;30(1):50–60. doi: 10.1038/s41422-019-0252-6 - DOI - PMC - PubMed
    1. Wang YS, Shelomi M. Review of black soldier fly (Hermetia illucens) as animal feed and human food. Foods. 2017;6(10). - PMC - PubMed
    1. Kawasaki K, Hashimoto Y, Hori A, Kawasaki T, Hirayasu H, Iwase S-I, et al.. Evaluation of black soldier fly (Hermetia illucens) larvae and pre-pupae raised on household organic waste, as potential ingredients for poultry feed. Animals (Basel). 2019;9(3):98. doi: 10.3390/ani9030098 - DOI - PMC - PubMed

LinkOut - more resources