. 2025 Feb 13;23(2):e3003020.
doi: 10.1371/journal.pbio.3003020. eCollection 2025 Feb.

Toll-1-dependent immune evasion induced by fungal infection leads to cell loss in the Drosophila brain

Affiliations

Toll-1-dependent immune evasion induced by fungal infection leads to cell loss in the Drosophila brain

Deepanshu N D Singh et al. PLoS Biol. .

Abstract

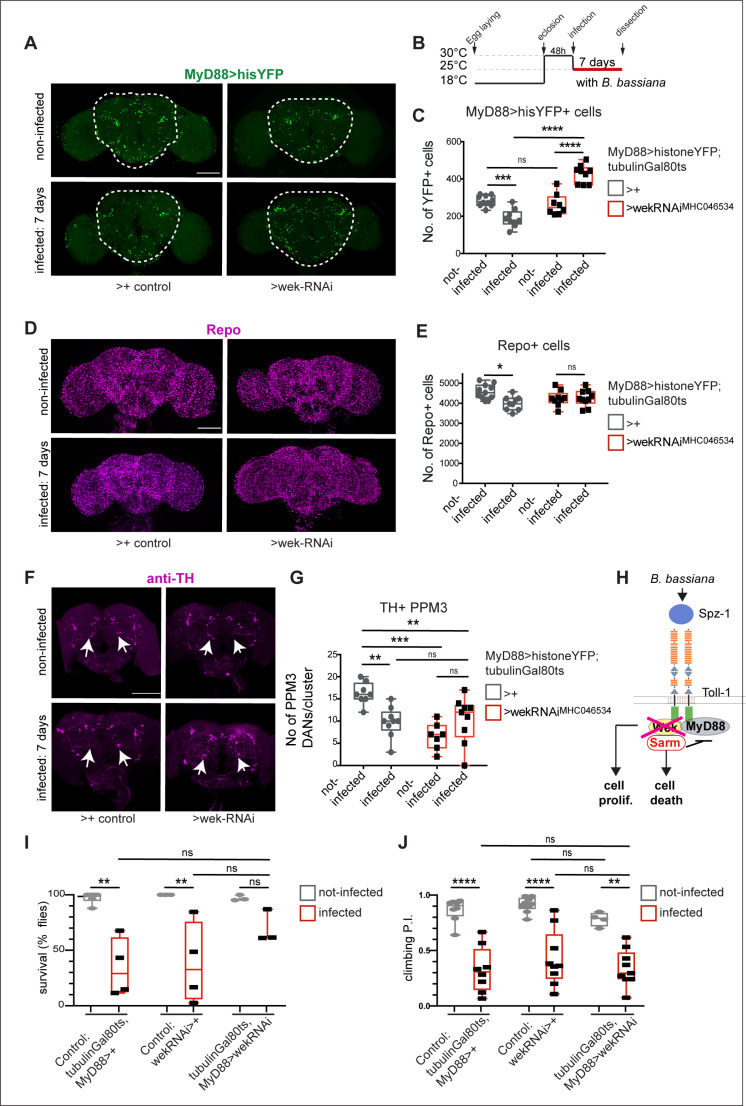
Fungi can intervene in hosts' brain function. In humans, they can drive neuroinflammation, neurodegenerative diseases and psychiatric disorders. However, how fungi alter the host brain is unknown. The mechanism underlying innate immunity to fungi is well-known and universally conserved downstream of shared Toll/TLR receptors, which via the adaptor MyD88 and the transcription factor Dif/NFκB, induce the expression of antimicrobial peptides (AMPs). However, in the brain, Toll-1 could also drive an alternative pathway via Sarm, which causes cell death instead. Sarm is the universal inhibitor of MyD88 and could drive immune evasion. Here, we show that exposure to the fungus Beauveria bassiana reduced fly life span, impaired locomotion and caused neurodegeneration. Beauveria bassiana entered the Drosophila brain and induced the up-regulation of AMPs, and the Toll adaptors wek and sarm, within the brain. RNAi knockdown of Toll-1, wek or sarm concomitantly with infection prevented B. bassiana-induced cell loss. By contrast, over-expression of wek or sarm was sufficient to cause neuronal loss in the absence of infection. Thus, B. bassiana caused cell loss in the host brain via Toll-1/Wek/Sarm signalling driving immune evasion. A similar activation of Sarm downstream of TLRs upon fungal infections could underlie psychiatric and neurodegenerative diseases in humans.


Conflict of interest statement

The authors have declared that no competing interests exist.

Figures

Fig 1
Fig 1. B. bassiana decreased longevity and impaired climbing.
(A) Infection chamber. (B) B. bassiana exposure reduced life span of wild-type (Oregon/CantonS) flies. Percentage surviving flies at each scored day Log-rank test p < 0.0001, n = 104 non-infected flies, and infected flies n = 104. (C) B. bassiana exposure impaired climbing of wild-type (Oregon/CantonS) flies, after 7 days of exposure. Dot plots, with lines indicating the mean and standard deviation. Each dot represents one cohort of 7–10 flies. Two-way ANOVA group statistics: 3-days-after infection versus 7-days-after infection (Row factor) p = 0.0122; Noninfected versus infected (Column factor): p < 0.0001; Interaction: p = 0.0048. Asterisks in the figure show Turkey’s multiple comparison correction tests. Sample sizes: 3 days after infection: n = 60 for each infected and non-infected. 7 days after infection: n = 51 for each infected and non-infected. **p < 0.01, ***p < 0.001. The data underlying panels B and C can be found in S5 Table Source data.
Fig 2
Fig 2. B. bassiana was detected within the fly brain.
B. bassiana infiltrated the Drosophila adult brain of wild-type flies (Oregon R) as visualised with (A) FM4–64 dye, revealing fungal cells as they co-localise with the nuclear dye DAPI+ (arrows). (B) Calcofluor white, revealing fungal cells adjacent to neurons within the central brain (arrows). (C) Transgenic B. bassiana-GFP found at the point of entry of the proboscis into the brain (arrows). Orthogonal views of one optical section. Nuclei labelled with DAPI. (D) DAPI labelled nuclei reveal the outer surface of the brain, including the BBB and B. bassiana-GFP crossing the BBB (sagittal and transverse views) and within the brain (transverse view). Orthogonal views of one optical section. (E) B. bassiana-GFP found at the entry point of the proboscis into the brain (arrow, anterior brain) and exit point of the oesofagus from the brain (arrow, posterior brain). (F-F’’) B. bassiana-GFP germlings or germinating spores colocalise with the neuronal marker DAPI (arrows, F’) and have filaments (arrows, F’’). (G) B. bassiana damaged the blood-brain barrier in the eye, as Dextran Red could diffuse within the retina in infected brains (arrows) but not in non-infected controls. Scale bars: (A, B, F) left: 100 mm; (A, B) right: 7 mm; (C, D) 50 μm, (E) 20 μm; (F’): 10 μm; (F’’): 5 μm; (G) 1,023 μm. Sample sizes: (1) FM4–64: n = 4/10 infected brains had fungal cells in the brain; non-infected n =  7. (2) CLW: n = 2/2 brains had fungal cells in the brain. (3) B. bassiana-GFP: n = 3/3 infected brains had spores in the brain; non-infected controls: n = 3. Non-infected controls for (A, C, D, E) in S1 Fig. Genotype of Drosophila melanogaster for all images: wild-type Oregon. Genotype of B. bassiana: 80.2 (A, B and F) and B. bassiana-GFP: EA-Bb-Tip 04/01 (C–E). See S1 Table for statistical details.
Fig 3
Fig 3. Exposure to B. bassiana activated Toll signalling within the adult brain.
(A) Drosophila wild-type (Oregon R) flies fed on B. bassiana spores that had been mixed with blue dye diluted in water. One Way ANOVA P value <  0.0001. (B) Non-infected repo>myr-tomato flies were fed a solution of B. bassiana-GFP spores, after which GFP + cells were found: (B) in the central brain, (B’) in the proboscis, (B’’) germling, (B’’’) in the entry site of the proboscis (anterior) into the brain, and exit site of esophagus (posterior), and (B’’’’) on glia within the brain. (C) Toll-1 > FlyBow and sarmNP0257 > FlyBow reveal expression in the proboscis, note axons and dendrites of sensory neurons in the labellum (arrows). n = 3–7 brains. (D) Activating Sarm+ neurons triggered the proboscis extension response, a proxy for feeding. (E) Quantification of (D). Chi-square test, ****p < 0.0001. Test: sarmNP0257>TrpA1 n = 34 flies, Control was responder line crossed to wild-type Oregon: UAS-TrpA1/+ n=34 Test: sarmNP7460>TrpA1 n = 40, Control: UAS-TrpA1/+ n = 40. 40. (F, G) B. bassianaB. bassiana infection of wild-type (Oregon R) flies for 7 days raised the expression levels of AMPs, wek and sarm within the brain. qRT-PCR data comparing fold change levels of (F) drs and mtk mRNA and (G) wek and sarm in infected brains, normalized to GAPDH as a housekeeping control. DeltaCT mean ± standard deviation. drs: Unpaired Student t test, *p < 0.05, n = 3 biological replicates (b.r.); mtk: p = 0.0634; n = 3 b.r.; wek: Unpaired Student t test ****p < 0.0001 n = 4 b.r.; sarm: t test: *p < 0.05, n = 4 b.r. Scale bar: (B) 50 μm; (B’, B’’’, B’’’’) 20 μm; (B’’) 5 μm; (C) 100 μm. “>” stands for GAL4/UAS and “+” stands for wild-type chromosome. See S4 Table for further details. The data underlying panel A, E, F and G can be found in S5 Table Source data.
Fig 4
Fig 4. Exposure to B. bassiana caused cell loss in the fly brain.
(A,B) Seven-day exposure to the B. bassiana caused loss of sarmNP0257 > HisYFP cells. Quantification in (B), Mann-Whitney U test, p = 0.002. (C,D) Seven-day exposure to B. bassiana caused loss of glia cells, visualised with anti-Repo antibodies. Quantification in (D), Unpaired Student t test, p = 0.002. (E) Seven-day exposure to B. bassiana reduced tyrosine hydroxylase (TH) expression. qRT-PCR showing fold-change relative to non-infected wild-type controls and normalised to GAPDH, mean ±  standard deviation. Unpaired Student t test on delta-Ct values p = 0.0011, n = 3 biological replicates. (F) Seven-day exposure to B. bassiana caused loss of dopaminergic neurons (DANs) visualised with anti-TH antibodies, in the posterior brain, quantification in (H): PAL, SP1, T1: Mann-Whitney U tests; PPL1, PPM1/2, PPL2, PPM3, SVP, VUM: Student t test; non-infected brains n = 12, infected brains n = 12. Arrows point to each DAN class. (G,I) Illustration of dopaminergic neurons in the adult brain. (J,K) Seven-day exposure to the B. bassiana caused loss of PAMs, quantification in (K): unpaired Student t test, p = 0.0043, non-infected brains n = 7, infected brains n = 6. Graphs in panels (B,D,K) show box-plots around the median, box with 50% of data points and whiskers with 25% of data points. Graphs in panels (E,H) show bar charts with mean ±  standard deviation. Dotted lines in (A,C) indicate ROI for automatic cell counting with DeadEasy software. **p < 0.01, ****p < 0.0001. Scale bars: (A, C, F): 100 μm. (J) 25 μm. Genotypes for tests: (A, B) Infected flies bearing the Histone-YFP reporter expressed in Sarm + cells (SarmNP0247 > hisYFP); (C-F, H, J): wild-type Oregon R. Controls: non-infected flies of the same genotypes. See S4 Table for further details. The data underlying panels B, D, E, H and K can be found in S5 Table for source data.
Fig 5
Fig 5. B. bassiana-induced cell loss depends on Toll-1.
(A) Seven-day exposure to B. bassiana caused loss of MyD88+ cells, visualised with tubGAL80ts; MyD88 > HisYFP, and this was rescued with adult-specific Toll-1-RNAi KK/100078 knockdown. (B) Diagram explaining the experimental temperature regime. (C) Quantification of data in (A). Two-way ANOVA: Infected versus not-infected: p = 0.7557; Genotypes: p < 0.0001; Interaction: p < 0.0001. Tukey’s multiple comparison correction tests. Sample sizes: non-infected control brains n = 10, infected control brains n = 9, non-infected Toll-1-RNAi brains n = 9, infected Toll-1RNAi brains n = 9. (D, E) Seven-day exposure to B. bassiana caused loss of glial cells visualised with anti-Repo antibodies (D), which was rescued with adult-specific Toll-1-RNAi KK/100078 knockdown, automatic quantification with DeadEasy in (E). Two-way ANOVA: Infected versus not-infected: p = 0.1003; Genotypes: p = 0.1285; interaction: p = 0.0666. Tukey’s multiple comparisons correction test. Sample sizes: non-infected control brains n = 11, infected control brains n = 8, non-infected Toll-1-RNAi brains n = 6, infected Toll-1-RNAi brains n = 6. (F,G) Seven-day exposure to B. bassiana caused loss of PPM3 DANs (arrows), visualised with anti-TH antibodies and this phenotype was rescued with adult-specific Toll-1-RNAi KK/100,078 knockdown. Arrows point to PPM3 neurons. Quantification in (G). Two-way ANOVA: Infected versus not-infected: p = 0.0042; Control versus Toll-1 RNAi: p = 0.8548; interaction: p = 0.1760, and Tukey’s multiple comparisons correction test. Sample sizes: non-infected control brains n = 8, infected control brains n = 9, non-infected Toll-1-RNAi brains n = 7, infected Toll-1-RNAi brains n = 6. (H) Illustration showing how adult-specific knock-down of Toll-1 expression prevented cell death after infection. (I, J) Adult restricted knock-down of Toll-1 in MyD88 cells improved (I) survival, (J) and climbing, at 7 days post-infection (n = 82−194 flies). (I) Two-way ANOVA survival: interaction: p = 0.0458; Genotype comparisons: p = 0.0495; Infected versus not-infected: p < 0.0001. (J) Two-way Anova climbing: interaction: p = 0.0017; Genotype comparisons: p = 0.0177; Infected versus not-infected: p < 0.0001. Dotted line in (A) indicates ROI for automatic cell counting with DeadEasy. Graphs in (C,E,G) show box-plots around the median, box with 50% of data points and whiskers with 25% of data points. Asterisks on graphs indicate multiple comparison correction tests: * p < 0.05, **p < 0.01, ****p < 0.0001. Scale bars: (A, D, F) 100 μm. Genotypes: Control: MyD88 GAL4 hisYFP/ + tubGAL80ts/ + flies, whereby the GAL4 driver line was outcrossed to wild-type. Test flies: MyD88 GAL4 hisYFP/UAS-Toll-1RNAi kk/100,078; tubGAL80ts/+. Infected versus not-infected compares flies of the same genotypes. See S4 Table for further details. The data underlying C, E, G, I, and J can be found in S5 Table Source data.
Fig 6
Fig 6. B. bassiana-induced cell loss requires Wek, but Wek has pleiotropic functions.
(A) Loss of MyD88 > HisYFP+ cells caused by seven-day exposure to B. bassiana was rescued with adult-specific wek-RNAiMHC046534 knockdown, and cell number increased further. (B) Diagram explaining the experimental regime. (C) Automatic quantification of data in (A). Two-way ANOVA: Infected versus not-infected p = 0.2327; Genotypes: p < 0.0001; Interaction: p < 0.0001, followed by Tukey’s multiple comparison correction test. Sample size: non-infected control brains n = 14, infected control brains n = 15, non-infected wek-RNAi brains n = 8, infected wek-RNAi brains n = 9. (D, E) Loss of Repo + glial cells caused by seven-day exposure to B. bassiana was rescued with adult-specific wek-RNAiMHC046534 knockdown, automatic quantification with DeadEasy in (E). Two-way ANOVA: Infected versus not-infected p = 0.0236; Genotypes: p = 0.7775; Interaction: p = 0.0231, and Tukey’s multiple comparisons correction test. Sample sizes: non-infected control brains n = 11, infected control brains n = 9, non-infected wek-RNAi brains n = 10, infected wek-RNAi brains n = 10. (F, G) Adult-specific wek-RNAiJF01681 knockdown decreased the number of TH + PPM3 DANs (arrows in F), suggesting that wek may be required for their differentiation. In fact, wek-RNAiiJF01681 knockdown did not rescue the cell loss caused by B. bassiana infection, but the infection did not reduce cell number further either. Two-way ANOVA: Infected versus not-infected: p = 0.3098; Genotypes: p = 0.0016; Interaction p = 0.0005, followed by Tukey’s multiple comparisons correction test. Sample sizes: non-infected control brains n = 8, infected control brains n = 9, non-infected wek-RNAi brains n = 7, infected wek-RNAi brains n = 9. (H) Diagram of Toll signalling pathway, whereby Wek links Toll-1 to Sarm, enabling Toll signalling to cause cell death and cell loss via Sarm, and this is rescued in some cells with wek RNAi knock-down. Wek also has functions independently of Sarm and MyD88, promoting adult neurogenesis. (I,J) wek-RNAi knock-down in MyD88 cells had no effect on survival at 7 days post-infection (I), nor in climbing (J) (n = 73–194). Two Way ANOVA survival: interaction: p = 0.2017; Genotype comparisons: p = 0.2437; Infected versus not-infected: p < 0.0001. (J) Two Way Anova climbing: interaction: p = 0.7414; Genotype comparisons: p = 0.2014; Infected versus not-infected: p < 0.0001. Dotted lines in (A) indicates ROI for automatic cell counting with DeadEasy software. Asterisks on graphs: * p < 0.05, **p < 0.01, ***p < 0.001, ****p < 0.0001. Scale bars: (A, D, F) 100 μm. Genotypes: Control: MyD88 GAL4 hisYFP/ + tubGAL80ts/ + flies, whereby the GAL4 driver line was outcrossed to wild-type. Test flies: MyD88 GAL4 hisYFP/UAS-wek-RNAiTRIPHMC045534; tubGAL80ts/ + . Infected versus not-infected compares flies of the same genotypes. See S4 Table for further details. The data underlying panels C, E, G, I and J can be found in S5 Table Source data.
Fig 7
Fig 7. B. bassiana-induced cell loss requires sarm.
(A) Seven-day exposure to the B. bassiana caused loss of MyD88 > HisYFP + cells, and this was rescued with adult-specific sarm-RNAiJF01681 knockdown, automatic quantification in (C). (B) Diagram explaining the experimental regime. (A, C) Two-way ANOVA: Infected versus not-infected p = 0.0077; Genotypes: p < 0.0001 Interaction: p < 0.0001, followed by Tukey’s multiple comparison correction test. Sample sizes: non-infected control brains n = 14, infected control brains n = 15, non-infected sarm-RNAi brains n = 8, infected sarm-RNAi brains n = 9. (D, E) Seven-day exposure to B. bassiana caused loss of Repo + glial cells (D), and this effect was rescued with adult-specific sarm-RNAiJF01681 knockdown, automatic quantification with DeadEasy in I. Two-way ANOVA: Infected versus not-infected p = 0.0205; Genotypes: p = 0.3649; Interaction: p = 0.0295, followed by Tukey’s multiple comparisons correction test. Sample sizes: non-infected control brains n = 11, infected control brains n = 9, non-infected sarm-RNAi brains n = 10, infected sarm-RNAi brains n = 7. (F, G) Seven-day exposure to B. bassiana caused loss of TH + PPM3 DANs (arrows), which was rescued with adult-specific sarm-RNAiJF01681 knockdown, quantification in (G). Two-way ANOVA: Infected versus not-infected p < 0.0001; Genotypes: p = 0.0071; Interaction: p = 0.0071, followed by Tukey’s multiple comparisons correction test. Sample sizes: non-infected control brains n = 8, infected control brains n = 9, non-infected sarm-RNAi brains n = 11, infected sarm-RNAi brains n = 8. (H) Diagram of Toll signalling pathway, whereby Sarm leads to cell death and cell loss. B. bassiana infection caused cell-loss is rescued with sarm RNAi knock-down. (I, J) sarm-RNAi knock-down in MyD88 cells slightly improved survival (I) and (J) climbing albeit not significantly (n = 76–194 flies). Two-way ANOVA survival: interaction: p = 0.5092; Genotype comparisons: p = 0.5591; Infected versus not-infected: p = 0.0001. (J) Two Way Anova climbing: interaction: p = 0.2992; Genotype comparisons: p = 0.0290; Infected versus not-infected: p < 0.0001. Dotted line in (A) indicates ROI for automatic cell counting with DeadEasy software. Data in graphs are shown as box-plots around the median. Asterisks on graphs indicate multiple comparisons corrections: *p < 0.05, **p < 0.01, ****p < 0.0001. Scale bars: (A, D, F) 100 μm. Genotypes: Controls: MyD88 GAL4 hisYFP/ + tubGAL80ts/+ flies, whereby the GAL4 driver line was outcrossed to wild-type. Test flies: MyD88 GAL4 hisYFP/+ tubGAL80ts/UAS-sarm-RNAiJF01681 Infected versus not-infected compares flies of the same genotypes. See S4 Table for further details. The data underlying panels C, E, G, I and J can be found in S5 Table Source data.
Fig 8
Fig 8. Increased Toll-1, wek and sarm levels can induce cell loss in the absence of infection.
(A,B) In the absence of infection, over-expression of activated Toll-110b in DANs (with THGAL4; R58E02GAL4) caused a rather mild and not significant decrease in PAMs. By contrast, over-expression of wek was sufficient to induce cell loss in 7-day-old flies. Sample sizes: control n = 9 brains, UAS-Toll-110b n = 12; UAS-wek-HA n = 13. One-way ANOVA p = 0.0003, multiple comparisons corrections Dunnett test to a fixed control. (C,D) Over-expression of sarm was sufficient to induce PAM cell loss in the absence of infection in 2-day-old flies. Sample sizes: control n = 13 brains, UAS-sarm n = 12. Student t test. Asterisks on graphs indicate multiple comparisons corrections: ****p < 0.0001. Scale bars: (A, C) 30μm. Flies were kept constantly at 25°C. (E) Diagram illustrating the multiple signalling pathways downstream of Toll-1 that can be activated by B. bassiana. Signalling via MyD88 and Dif/NFκB results in fungal elimination, whereas signalling via Wek and Sarm inhibits MyD88-dependent innate immunity and drives host cell death instead. Genotypes: Controls: THGAL4; R58E02GAL4/+ flies, whereby the GAL4 driver was outcroseed to wild-type. Test flies: THGAL4/UAS-Toll-110b; R58E02GAL4/+ ; THGAL4; R58E02GAL4/UAS-wek-HA; THGAL4; R58E02GAL4/UAS-dsarm. See S4 Table for further details. The data underlying panels B and D can be found in S5 Table source data.

References

    1. de Bekker C. Ophiocordyceps-ant interactions as an integrative model to understand the molecular basis of parasitic behavioral manipulation. Curr Opin Insect Sci. 2019;33:19–24. doi: 10.1016/j.cois.2019.01.005 - DOI - PubMed
    1. de Bekker C, Das B. Hijacking time: how Ophiocordyceps fungi could be using ant host clocks to manipulate behavior. Parasite Immunol. 2022;44(3):e12909. doi: 10.1111/pim.12909 - DOI - PMC - PubMed
    1. Elya C, Lok TC, Spencer QE, McCausland H, Martinez CC, Eisen M. Robust manipulation of the behavior of Drosophila melanogaster by a fungal pathogen in the laboratory. Elife. 2018;7:e34414. Epub 2018/07/27. doi: 10.7554/eLife.34414 ; PMCID: PMCPMC6067884 - DOI - PMC - PubMed
    1. Inamdar AA, Hossain MM, Bernstein AI, Miller GW, Richardson JR, Bennett JW. Fungal-derived semiochemical 1-octen-3-ol disrupts dopamine packaging and causes neurodegeneration. Proc Natl Acad Sci U S A. 2013;110(48):19561–6. doi: 10.1073/pnas.1318830110 - DOI - PMC - PubMed
    1. Inamdar AA, Masurekar P, Bennett JW. Neurotoxicity of fungal volatile organic compounds in Drosophila melanogaster. Toxicol Sci. 2010;117(2):418–26. doi: 10.1093/toxsci/kfq222 - DOI - PubMed

MeSH terms

LinkOut - more resources