. 2025 Mar 12;5(1):100199.
doi: 10.1016/j.bpr.2025.100199. Epub 2025 Feb 11.

Robust quantification of cellular mechanics using optical tweezers

Affiliations

Robust quantification of cellular mechanics using optical tweezers

Wessel S Rodenburg et al. Biophys Rep (N Y). .

Abstract

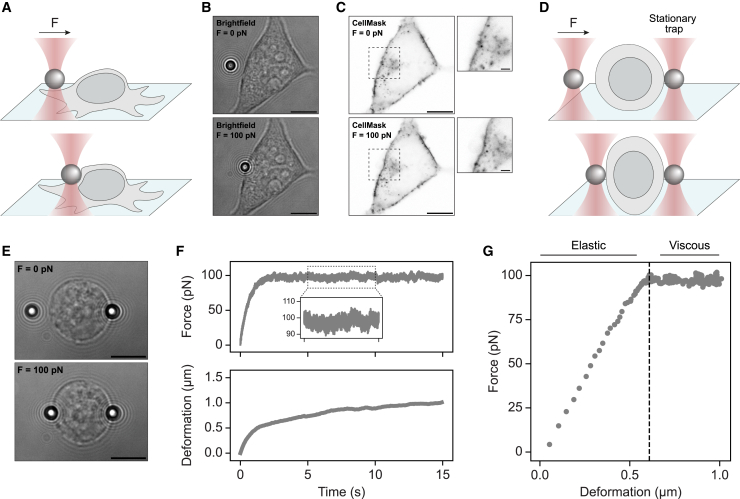
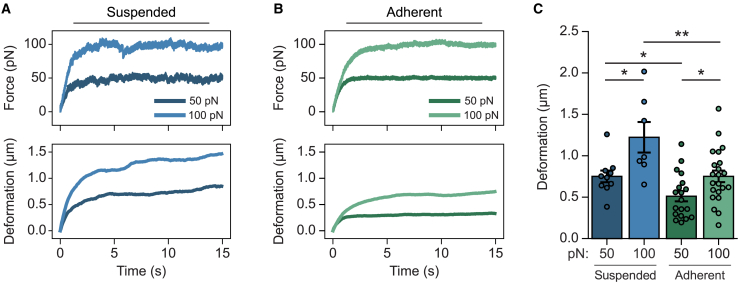
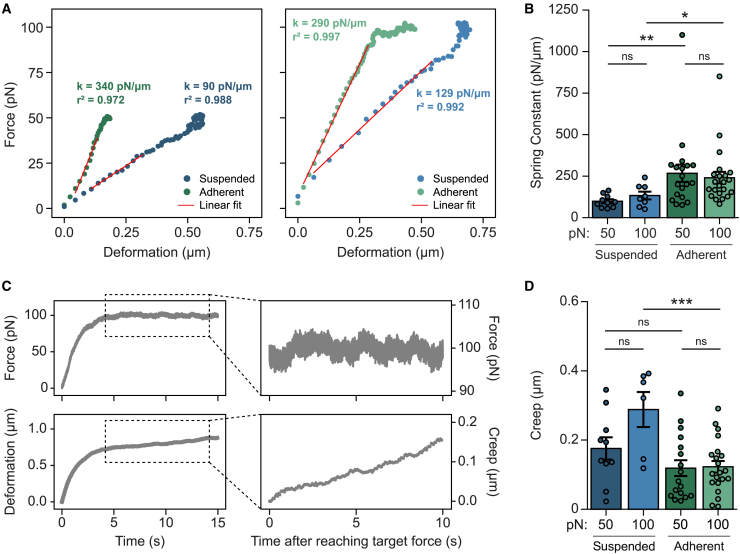
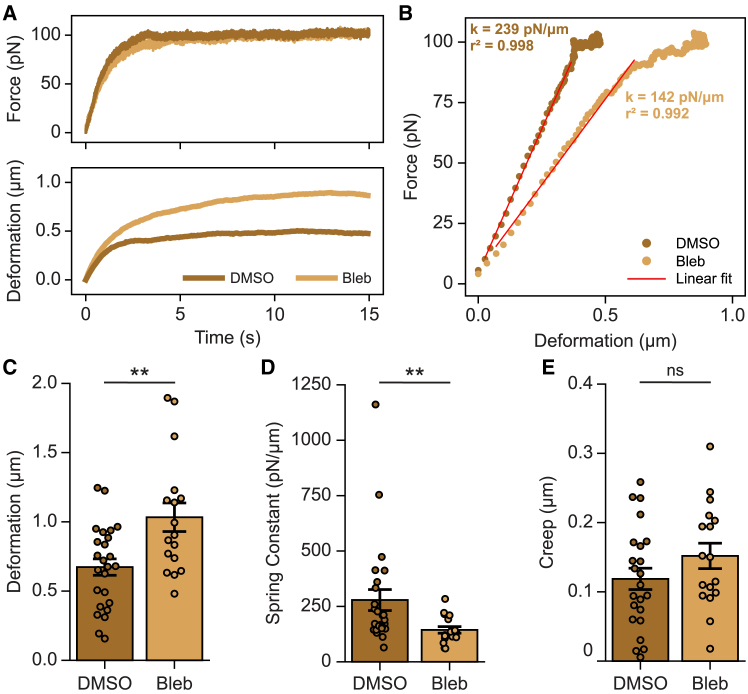
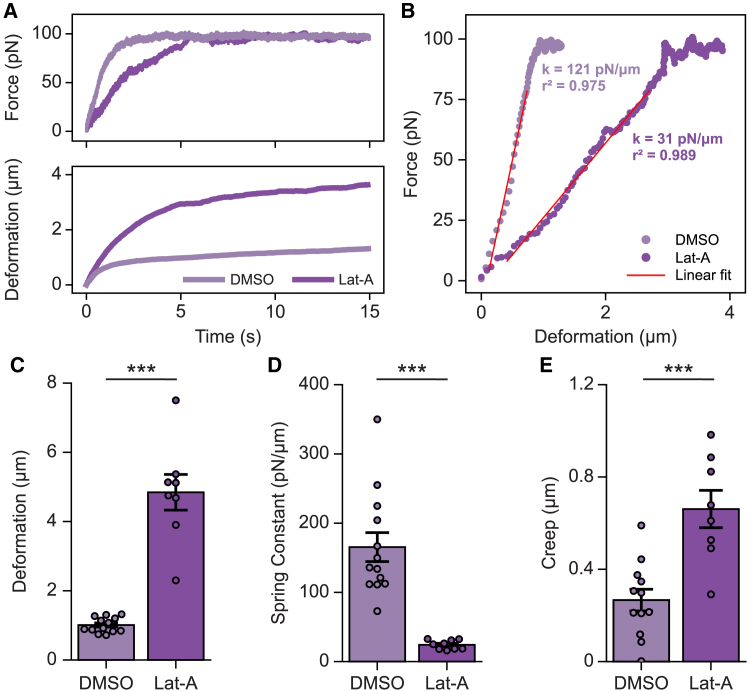
The mechanical properties of cells are closely related to function and play a crucial role in many cellular processes, including migration, differentiation, and cell fate determination. Numerous methods have been developed to assess cell mechanics under various conditions, but they often lack accuracy on biologically relevant piconewton-range forces or have limited control over the applied force. Here, we present a straightforward approach for using optically trapped polystyrene beads to accurately apply piconewton-range forces to adherent and suspended cells. We precisely apply a constant force to cells by means of a force-feedback system, allowing for quantification of deformation, cell stiffness, and creep response from a single measurement. Using drug-induced perturbations of the cytoskeleton, we show that this approach is sensitive to detecting changes in cellular mechanical properties. Collectively, we provide a framework for using optical tweezers to apply highly accurate forces to adherent and suspended cells and describe straightforward metrics to quantify cellular mechanical properties.


Conflict of interest statement

Declaration of interests The authors declare no competing interests.

Figures

Figure 1
Figure 1
Deformation of adherent and suspended cells using optical tweezers. (A) Schematic illustration of an optical tweezers experiment on adherent cells. Cells are seeded on a fibronectin-coated surface. A single bead is optically trapped and moved along the lateral direction to apply force. (B) Bright-field images of an adherent cell before force application (top) and during 100 pN force application (bottom). Scale bars, 10 μm. (C) Inverted confocal images of the cell membrane (CellMask plasma membrane marker) corresponding with the bright-field images in (B). Scale bars, 10 μm. Zoomed-in insets show local deformation. Scale bars, 2 μm. (D) Schematic illustration of an optical tweezers experiment on suspended cells. A stationary optically trapped bead serves to immobilize the cell while the other is moved along the lateral direction to apply force. (E) Bright-field images of a suspended cell before force application (top) and during 100 pN force application (bottom). Scale bars, 10 μm. See also Video S1. (F) Force (top) and corresponding deformation (bottom) plotted over time for the suspended cell shown in (E). A constant load of 100 pN was applied to the cell for ∼10 s while the deformation was monitored. (G) Force-deformation curve of the suspended cell shown in (E). Dashed line indicates the moment the target force of 100 pN is reached.
Figure 2
Figure 2
Quantification of cellular deformation. (A) Representative force (top) and corresponding deformation (bottom) curves of suspended cells deformed with a target force of 50 or 100 pN. (B) Representative force (top) and corresponding deformation (bottom) curves of adherent cells deformed with a target force of 50 or 100 pN. (C) Cellular deformation after 10 s of target force application. Data are shown as mean ± SE. n = 10, 7, 19, and 22 cells, respectively. ∗p < 0.05 and ∗∗p < 0.01, two-sample t-test.
Figure 3
Figure 3
Quantifications of cellular mechanical properties. (A) Representative force-deformation curves of a suspended and an adherent cell deformed with a target force of 50 (left) and 100 (right) pN. Red lines indicate linear fits to calculate the spring constant (k). (B) Spring constants calculated from linear fits of individual curves as shown in (A). Data are shown as mean ± SE. n = 10, 8, 19, and 22 cells, respectively. ∗p < 0.05 and ∗∗p < 0.01, Mann-Whitney U test. (C) Representative force (top) and corresponding deformation (bottom) curves of an adherent cell deformed with a target force of 100 pN (left) and a zoom-in on the creep response (right). The creep response was monitored for 10 s after reaching the target force. (D) Creep after 10 s of target force application. Data are shown as mean ± SE. n = 10, 6, 17, and 21 cells, respectively. ∗∗∗p < 0.001, two-sample t-test.
Figure 4
Figure 4
Validation using inhibition of myosin II. (A) Representative force (top) and corresponding deformation (bottom) curves of adherent cells treated with DMSO or 20 μM blebbistatin. (B) Representative force-deformation curves of adherent cells treated with DMSO or 20 μM blebbistatin. Red lines indicate linear fits used to calculate the spring constant (k). (C) Cellular deformation after 10 s of target force application. Data are shown as mean ± SE. n = 25 and 17 cells, respectively. ∗∗p < 0.01, two-sample t-test. (D) Spring constants calculated from linear fits of individual curves as shown in (B). Data are shown as mean ± SE. n = 25 and 17 cells, respectively. ∗∗p < 0.01, Mann-Whitney U test. (E) Creep after 10 s of target force application. Data are shown as mean ± SE. n = 23 and 17 cells, respectively. p = 0.17, two-sample t-test.
Figure 5
Figure 5
Validation using inhibition of actin polymerization. (A) Representative force (top) and corresponding deformation (bottom) curves of suspended cells treated with DMSO or 1 μM latrunculin-A. (B) Representative force-deformation curves of suspended cells treated with DMSO or 1 μM latrunculin-A. Red lines indicate linear fits used to calculate the spring constant (k). (C) Cellular deformation after 10 s of target force application. Data are shown as mean ± SE. n = 13 and 8 cells, respectively. ∗∗∗p < 0.001, two-sample t-test. (D) Spring constants calculated from linear fits of individual curves as shown in (B). Data are shown as mean ± SE. n = 13 and 9 cells, respectively. ∗∗∗p < 0.001, two-sample t-test. (E) Creep after 10 s of target force application. Data are shown as mean ± SE. n = 12 and 8 cells, respectively. ∗∗∗p < 0.001, two-sample t-test.

Similar articles

References

    1. Martino F., Perestrelo A.R., et al. Forte G. Cellular Mechanotransduction: From Tension to Function. Front. Physiol. 2018;9:824. - PMC - PubMed
    1. Discher D.E., Janmey P., Wang Y.L. Tissue Cells Feel and Respond to the Stiffness of Their Substrate. Science. 2005;310:1139–1143. - PubMed
    1. Mathur A.B., Collinsworth A.M., et al. Truskey G.A. Endothelial, cardiac muscle and skeletal muscle exhibit different viscous and elastic properties as determined by atomic force microscopy. J. Biomech. 2001;34:1545–1553. - PubMed
    1. Solon J., Levental I., et al. Janmey P.A. Fibroblast Adaptation and Stiffness Matching to Soft Elastic Substrates. Biophys. J. 2007;93:4453–4461. - PMC - PubMed
    1. Janmey P.A., Fletcher D.A., Reinhart-King C.A. Stiffness Sensing by Cells. Physiol. Rev. 2020;100:695–724. - PMC - PubMed

LinkOut - more resources