Phenotyping the responses to systemic corticosteroids in the management of asthma attacks (PRISMA)
- PMID: 39947666
- PMCID: PMC12095907
- DOI: 10.1183/13993003.02391-2024
Phenotyping the responses to systemic corticosteroids in the management of asthma attacks (PRISMA)
Abstract
Background: Asthma attacks are heterogeneous. It is not known whether the response to oral corticosteroids (OCS) in acute asthma varies according to type 2 (T2) inflammatory biomarkers, blood eosinophil count (BEC) and fractional exhaled nitric oxide (F ENO). We aimed to explore the relationship between T2 biomarkers and response to OCS in acute asthma.
Methods: We conducted a longitudinal observational study of people experiencing an asthma attack evaluated before and after a 7-day OCS course. The primary outcome was post-bronchodilator change in forced expiratory volume in 1 s (FEV1) according to ordinal BEC-F ENO three-group categories (T2-Low/Low: BEC <0.15×10⁹ cells·L-1 and F ENO <25 ppb; T2-High/High: BEC ≥0.30×10⁹ cells·L-1 and F ENO ≥35 ppb; T2-Mid: not meeting Low/Low or High/High criteria). A key secondary outcome was the change in Asthma Control Questionnaire-5 score. Exploratory outcomes included OCS-attributable adverse events.
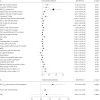
Results: 53 people were enrolled, with 16 (30%) T2-Low/Low, 27 (51%) T2-Mid and 10 (19%) T2-High/High asthma attacks. Post-bronchodilator FEV1 changes increased with combined BEC-F ENO elevation (p for interaction=0.007), peaking in the T2-High/High phenotype (0.390±0.512 L, p for trend<0.0001). Conversely, T2-Low/Low attacks showed nonsignificant FEV1 changes (0.017±0.153 L). In univariable and multivariable analyses, only ordinal BEC-F ENO stratification, not symptoms nor FEV1, predicted subsequent post-bronchodilator FEV1 improvement. All patients had improved Asthma Control Questionnaire-5 score, numerically peaking in the T2-High/High phenotype (-1.58±0.60, p for trend=0.08). All groups experienced similar OCS-attributable adverse events, with 33 patients (62%) reporting at least one event.
Conclusions: We found that objective improvement following OCS is confined to T2-High events. As in chronic asthma, greater T2 burden identifies a distinct clinical and therapeutic trajectory, whereas OCS‑related adverse events are uniformly distributed.
Copyright ©The authors 2025.
Conflict of interest statement
Conflict of interest: C. Celis-Preciado has received an education scholarship from the Université de Sherbrooke, within the current work; outside the current work, he has received speaker honoraria from AstraZeneca, GlaxoSmithKline and Sanofi-Regeneron, and consultancy fees from AstraZeneca, GlaxoSmithKline and Sanofi-Regeneron. S. Leclerc reports speaker honoraria from AstraZeneca, outside of the submitted work. F.A. Vézina reports speaker honoraria from AstraZeneca, Sanofi-Regeneron, GlaxoSmithKline, Boehringer Ingelheim and Novartis, outside of the submitted work. P. Lachapelle reports speaker honoraria from AstraZeneca, Sanofi-Regeneron, GlaxoSmithKline, Boehringer Ingelheim and Novartis, and has received consultancy fees from AstraZeneca, GlaxoSmithKline and Sanofi-Regeneron, outside the submitted work. S. Couillard reports he has received unrestricted research grants from Sanofi-Genyme-Regeneron, bioMérieux and the Québec Air-Intersectorialité-Respiratoire Network; he is the holder of the Association Pulmonaire du Québec's Research Chair in Respiratory Medicine; and he is a Clinical Research Scholar of the Fonds de Recherche du Québec, within the submitted work. Outside the submitted work, he reports unrestricted research grants from NIHR Oxford BRC, the Quebec Respiratory Health Research Network, the Fondation Québécoise en Santé Respiratoire, AstraZeneca, bioMérieux, Academy of Medical Sciences and the Association Pulmonaire du Québec; speaker honoraria from AstraZeneca, GlaxoSmithKline, Sanofi-Regeneron and Valeo Pharma; consultancy fees from FirstThought, AstraZeneca, GlaxoSmithKline, Sanofi-Regeneron, Access Biotechnology and Access Industries; sponsorship to attend/speak at international scientific meetings from AstraZeneca and Sanofi-Regeneron; is an advisory board member and holds stock options for Biometry Inc., a company which is developing a FENO device (myBiometry); and he advised the Institut National d'Excellence en Santé et Services Sociaux (INESSS) for an update of the asthma general practice information booklet for general practitioners. The remaining authors report no potential conflicts of interest.
Figures


Comment in
-
Are systemic corticosteroids needed for all asthma exacerbations?Eur Respir J. 2025 May 22;65(5):2500370. doi: 10.1183/13993003.00370-2025. Print 2025 May. Eur Respir J. 2025. PMID: 40404196 No abstract available.
-
Reply to: Type 2 inflammatory biomarkers in asthma and COPD: what we think we know.Eur Respir J. 2025 Jul 24;66(1):2500949. doi: 10.1183/13993003.00949-2025. Print 2025 Jul. Eur Respir J. 2025. PMID: 40707162 No abstract available.
-
Type 2 inflammatory biomarkers in asthma and COPD: what we think we know.Eur Respir J. 2025 Jul 24;66(1):2500685. doi: 10.1183/13993003.00685-2025. Print 2025 Jul. Eur Respir J. 2025. PMID: 40707164 No abstract available.
References
-
- Global Initiative for Asthma (GINA) . Global Strategy for Asthma Management and Prevention (2024 update). 2024. Available from: https://ginasthma.org/
Publication types
MeSH terms
Substances
LinkOut - more resources
Full Text Sources
Medical
Research Materials
