. 2025 Feb 13:388:e080749.
doi: 10.1136/bmj-2024-080749.

Uncertainty of risk estimates from clinical prediction models: rationale, challenges, and approaches

Affiliations

Uncertainty of risk estimates from clinical prediction models: rationale, challenges, and approaches

Richard D Riley et al. BMJ. .

Abstract

Clinical prediction models estimate an individual’s risk (probability) of a health related outcome to help guide patient counselling and clinical decision making. Most models provide a single point estimate of risk but without the associated uncertainty. Riley and colleagues argue that this needs to change, as understanding uncertainty of risk estimates helps to inform critical evaluation of a model and may impact shared decision making. Examples are provided to illustrate uncertainty in risk estimates, and key methods to quantify and present uncertainty are discussed.


Conflict of interest statement

Competing interests: All authors have completed the ICMJE uniform disclosure form at www.icmje.org/disclosure-of-interest/ and declare: support for the submitted work from Engineering and Physical Sciences Research Council, National Institute for Health and Care Research, Cancer Research UK, US National Center for Advancing Translational Sciences, Vanderbilt Institute for Clinical and Translational Research, details in the funding section. No financial relationships with any organisations that might have an interest in the submitted work in the previous three years; RDR receives royalties for the textbooks “Prognosis Research in Healthcare” and “Individual Participant Data Meta-Analysis”. RDR and GSC are Statistical Editors for the BMJ for which they receive consulting fees.

Figures

Fig 1
Fig 1
A screenshot of the output from the webtool of the CRASH prediction model when applied to a hypothetical individual. The CRASH models are logistic regression models that estimate the risks of 14 day mortality and six month unfavourable outcome (death or severe disability) in patients with traumatic brain injury. The output includes a point estimate of risk (expressed as a %) and the corresponding 95% uncertainty interval (labelled as confidence interval (CI)) (see www.crash.lshtm.ac.uk/Risk%20calculator/index.html)
Fig 2
Fig 2
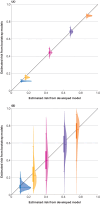
1000 risk estimates (“predictions”, y axis) sampled from the uncertainty distribution for nine individuals (with true risks (P), x axis, between 0.1 and 0.9), across six different models developed in sample sizes (nD) of 50, 100, 385, 500, 1000, and 5000 participants. Each model was produced by fitting a lasso logistic regression to a different random sample of individuals simulated from the same population with a true overall risk of 0.5, considering one genuine predictor (X∼N(0,4)) and 10 noise variables (Z1,…, Z10∼N(0,1)). Figure adapted from Riley and Collins with permission. The smaller the sample size, the wider the uncertainty distribution, even spanning the entire range of 0 to 1 in small samples.
Fig 3
Fig 3
Uncertainty distributions derived from bootstrapping for a particular individual after fitting a logistic regression model to estimate risk of having prostate cancer. Based on the model, panel A shows their risk of prostate cancer and the bottom panel shows the difference in their utility of choosing biopsy or no biopsy. The difference in utility is zero if their risk of prostate cancer is 0.05 (5%), as this is the individual’s chosen threshold for biopsy (see supplementary material S1). When ignoring uncertainty in the estimated model parameters, the individual’s point risk estimate is 0.051 (5.1%) and their expected utility is higher for biopsy than no biopsy. By contrast, when uncertainty is accounted for, panel A shows their point (mean) risk estimate is 0.047 (4.7%), as this is below the individual’s chosen risk threshold of 0.05 (5%), it suggests no biopsy is the preferred decision. Panel B has an expected (mean) value of distribution of −0.11. As this is negative, no biopsy is suggested as the preferred decision
Fig 4
Fig 4
Uncertainty intervals and distributions produced by applying the bootstrap process to models developed with large (40 830 participants, top) and small (500 participants, bottom) datasets. We developed a prediction model to estimate the risk of 30 day mortality in individuals diagnosed with an acute myocardial infarction, using the GUSTO-1 dataset. A lasso logistic regression model was fitted considering eight predictors, as described elsewhere, firstly using (panel A) the full sample of 40 830 participants (2851 deaths) referred to as Model A; and (panel B) a random subsample of 500 participants (35 deaths) referred to as Model B. After fitting each model, we applied the bootstrap process (using 10 000 bootstrap models) to derive uncertainty distributions and intervals for the same five individuals. Intervals are defined between capped lines (95%) and coloured boxes (50%).
Fig 5
Fig 5
Example of a calibration plot containing a smoothed calibration curve and its 95% confidence interval, from an external validation of a model to estimate five year recurrence risk after a primary breast cancer diagnosis; modified from Riley et al with permission. Histograms beneath the plot show the distribution of estimated risks for those with and with no recurrence by five years. Example code to generate this plot is available from https://www.prognosisresearch.com/software. CI=confidence interval

References

    1. Arshi B, Smits LJ, Wynants L, Cowley LE, Reeve K, Rijnhart E. Number of publications on new clinical prediction models: a systematic literature search. OSFpreprints 10.31219/osfio/4txc6. 2023. - DOI - PMC - PubMed
    1. Hippisley-Cox J, Coupland C, Brindle P. Development and validation of QRISK3 risk prediction algorithms to estimate future risk of cardiovascular disease: prospective cohort study. BMJ 2017;357:j2099. 10.1136/bmj.j2099 - DOI - PMC - PubMed
    1. Maas AI, Marmarou A, Murray GD, Teasdale SG, Steyerberg EW. Prognosis and clinical trial design in traumatic brain injury: the IMPACT study. J Neurotrauma 2007;24:232-8. 10.1089/neu.2006.0024 - DOI - PubMed
    1. Perel P, Arango M, Clayton T, et al. MRC CRASH Trial Collaborators . Predicting outcome after traumatic brain injury: practical prognostic models based on large cohort of international patients. BMJ 2008;336:425-9. 10.1136/bmj.39461.643438.25 - DOI - PMC - PubMed
    1. Riley RD, Snell KIE, Archer L, et al. . Evaluation of clinical prediction models (part 3): calculating the sample size required for an external validation study. BMJ 2024;384:e074821. 10.1136/bmj-2023-074821 - DOI - PMC - PubMed

LinkOut - more resources