. 2025 Mar 4;12(3):ENEURO.0384-24.2025.
doi: 10.1523/ENEURO.0384-24.2025. Print 2025 Mar.

Facial Paralysis Algorithm: A Tool to Infer Facial Paralysis in Awake Mice

Affiliations

Facial Paralysis Algorithm: A Tool to Infer Facial Paralysis in Awake Mice

Elías Perrusquia Hernández et al. eNeuro. .

Abstract

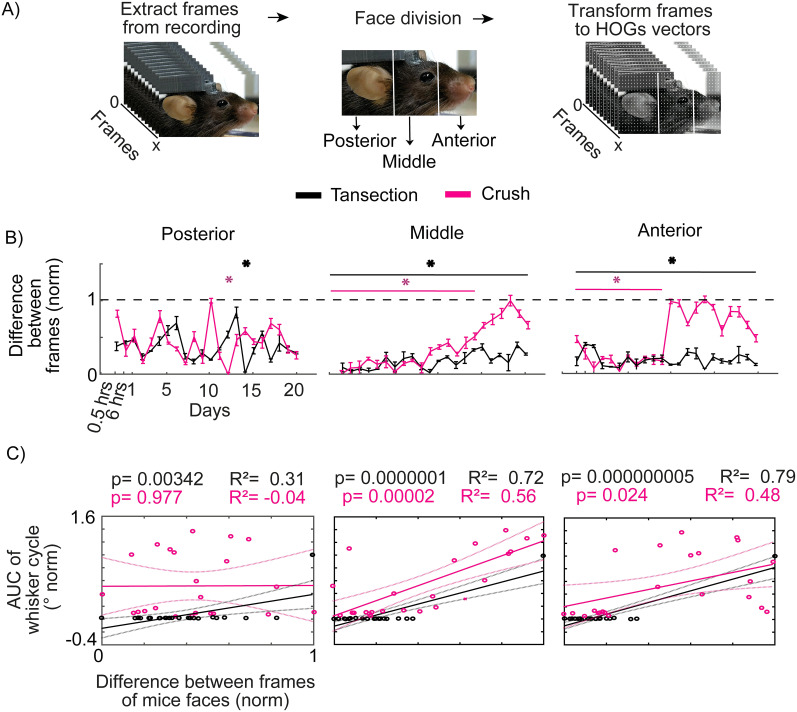
Facial paralysis is characterized by an injury to the facial nerve, causing the loss of the functions of the structures that it innervates, as well as changes in the motor cortex. Current models have some limitations for the study of facial paralysis, such as movement restriction, the absence of studying awake animals in behavioral contexts, and the lack of a model that fully evaluates facial movements. The development of an algorithm capable of automatically inferring facial paralysis and overcoming the existing limitations is proposed in this work. In C57/BL6J mice, we produced both irreversible and reversible facial paralysis. Video recordings were made of the faces of paralyzed mice to develop an algorithm for detecting facial paralysis applied to mice, which allows us to predict the presence of reversible and irreversible facial paralysis automatically. At the same time, the algorithm was used to track facial movement during gustatory stimulation and extracellular electrophysiological recordings in the anterolateral motor cortex (ALM). In the basal state, mice can make facial expressions, whereas the algorithm can detect this movement. Simultaneously, such movement is correlated with the activation in the ALM. In the presence of facial paralysis, the algorithm cannot detect movement. Furthermore, it predicts that the condition exists, and the neuronal activity in the cortex is affected with respect to the evolution of facial paralysis. This way, we conclude that the facial paralysis algorithm applied to mice allows for inferring the presence of experimental facial paralysis and its neuronal correlates for further studies.

Keywords: artificial vision; facial paralysis; nerve injury.


Conflict of interest statement

The authors declare no competing financial interests.

Figures

Figure 1.
Figure 1.
Experimental design. A, Schematic of the semirestricted movement system and simultaneous video recording of whiskers and the face of the mouse. B, Surgical process of facial paralysis models of nerve injury by transection and compression. C, Monitoring of the force applied to the facial nerve when it is compressed; the gray lines represent each mouse (n = 3) and the black line average (p ≤ 0.05 one-way ANOVA test). D, Experimental timeline. Detailed statistics in Extended Data Table 1-1.
Figure 2.
Figure 2.
Effect of facial paralysis on whisker movement cycle. Whisker movement monitoring of a single mouse per group (A) transection, (B) crush, and (C) sham, prior to surgery and on Days 1, 10, and 20 postoperatively. The graphs on the left side of each column represent the dynamics of whisker movement over 2 s of evaluation, and on the right, their movement cycle is shown. Complementary information is shown in Extended Data Figures 2-1–2-2 and Table 2-1.
Figure 3.
Figure 3.
Physiological changes in whisker movement after facial paralysis. A, Area under the curve of the whisker movement cycle assessed from half an hour to Day 20 after surgery (baseline vs lesion *p  ≤  0.05 one-way ANOVA test, Tukey’s test p ≤ 0.05, n = 3). B, Proportion of high and low amplitudes obtained from the whisker movement cycle (baseline vs lesion in high amplitudes *p ≤ 0.05 and baseline vs lesion in low amplitudes #p ≤ 0.05 chi-square test). C, Spectrogram of whisker movement frequency over 2 s; the left graph represents one mouse and the right the average of the transection injury group. This description is repeated in D (baseline vs lesion *p ≤ 0.05 one-way ANOVA test, Tukey’s test p ≤ 0.05), E (baseline vs lesion in high amplitudes **p ≤ 0.05 and baseline vs lesion in low amplitudes ##p ≤ 0. 05 chi-square test), and F for the compression injury group (n = 3) and G (baseline vs surgery *p ≤ 0.05 one-way ANOVA test, Tukey’s test p ≤ 0.05), H (baseline vs lesion in high amplitudes *p ≤ 0.05 and baseline vs lesion in low amplitudes #p ≤ 0.05 chi-square test), and I for the sham group (n = 3). The dotted lines in A, D, and G represent the baseline. Detailed statistics in Extended Data Tables 3-1–3-4.
Figure 4.
Figure 4.
Involvement of the anterior, middle, and front parts of the face in the identification of facial paralysis. A, Schematic of the processing of the video recording of the faces of the mice. B, Differences between HOGs during 2 min of evaluation from half an hour to 20 d after the facial injury (n = 3). The dotted line represents the baseline. The left panel symbolizes the posterior area of the face (baseline vs transection *p ≤ 0.05 one-way ANOVA test, Tukey’s test p ≤ 0.05; baseline vs crush *p ≤ 0.05 one-way ANOVA test, Tukey’s test p ≤ 0.05). The middle panel is the middle area of the face (baseline vs transection *p ≤ 0.05 one-way ANOVA test, Tukey’s test p ≤ 0.05; baseline vs crush *p ≤ 0.05 one-way ANOVA test, Tukey’s test p ≤ 0.05). The right panel shows the anterior face (baseline vs transection *p ≤ 0.05 one-way ANOVA test, Tukey’s test p ≤ 0.05; baseline vs crush *p ≤ 0.05 one-way ANOVA test, Tukey’s test p ≤ 0.05). C, Correlation between the difference between HOGs of the face areas of the mice (posterior, left panel; middle, middle panel; and anterior, right panel, n = 3) with the area under the curve of the whisker movement cycle. The points represent each of the 23 evaluations performed. The solid line shows the linear regression, and the dotted lines represent the confidence limit. Detailed statistics in Extended Data Tables 4-1–4-2. Complementary information is shown in Extended Data Figures 4-1–4-2 and Table 4-3.
Figure 5.
Figure 5.
Design and implementation of the FaPA. A, Step-by-step diagram of the FaPA design. B, Percentage of change between the difference of the frames during 2 min of evaluation and the threshold obtained. Use of the threshold for facial paralysis prediction in a binary decision-making system (facial paralysis exists or not) (C) for the transection injury group (n = 3) and (D) for the compression injury group (n = 3). Complementary information is shown in Extended Data Figures 5-1–5-2.
Figure 6.
Figure 6.
Use of the prediction algorithm during the study of facial expression. A, Design of the algorithm to detect facial paralysis. Detection of facial paralysis using the CA for the transection (B, n = 3) and compression (C, n = 3) groups. Tracking the similarity between facial movement and the prototype for the transection (D, n = 1) and compression (E, n = 1) groups. The top panels correspond to the baseline evaluation, the middle ones to Day 1, and the bottom ones to Day 20 after facial injury. The bar under each graph indicates the moment in which there is or no movement. The bar on the right shows the conclusion of the CA. The black line at 0 shows the moment of sucrose release. Detailed statistics in Extended Data Table 6-5. Complementary information is shown in Extended Data Figures 6-1–6-2 and Tables 6-1–6-4.
Figure 7.
Figure 7.
Electrophysiological recordings in the ALM during facial expression and movement. A, Location of the electrode array implanted in the ALM in the histological section of a recorded mouse. B, C, The top panel depicts the tracking of the similarity of the facial expression with the pleasurable prototype. In the top panel, the bar below shows the moment of facial movement. The middle panel shows the heat map of the population neuronal activity in the ALM; the line inside the heat map is the population average. The bottom panel shows the cross-covariance of neuronal activity with facial expression (thick line) and movement (thin line); (B) for the transection lesion group (n = 2) and (C) for compression (n = 2). The line aligned at 0 shows the moment of facial expression onset. Detailed statistics in Extended Data Table 7-1. Complementary information is shown in Extended Data Table 7-2.

Similar articles

Cited by

References

    1. Attiah MA, de Vries J, Richardson AG, Lucas TH (2017) A rodent model of dynamic facial reanimation using functional electrical stimulation. Front Neurosci 11:193. 10.3389/fnins.2017.00193 - DOI - PMC - PubMed
    1. Cakmak YO (2019) Concerning auricular vagal nerve stimulation: occult neural networks. Front Hum Neurosci 13:421. 10.3389/fnhum.2019.00421 - DOI - PMC - PubMed
    1. Chacon MA, Echternacht SR, Leckenby JI (2020) Outcome measures of facial nerve regeneration: a review of murine model systems. Ann Anat 227:151410. 10.1016/j.aanat.2019.07.011 - DOI - PubMed
    1. Clayton KK, Stecyk KS, Guo AA, Chambers AR, Chen K, Hancock KE, Polley DB (2024) Sound elicits stereotyped facial movements that provide a sensitive index of hearing abilities in mice. Curr Biol 34:1605–1620.e5. 10.1016/j.cub.2024.02.057 - DOI - PMC - PubMed
    1. Dolensek N, Gehrlach DA, Klein AS, Gogolla N (2020) Facial expressions of emotion states and their neuronal correlates in mice. Science 368:89–94. 10.1126/science.aaz9468 - DOI - PubMed

LinkOut - more resources