. 2025 Feb 13;11(1):5.
doi: 10.1038/s41526-025-00458-z.

Plyometric training increases thickness and volume of knee articular cartilage in mice

Affiliations

Plyometric training increases thickness and volume of knee articular cartilage in mice

Marco Chiaberge et al. NPJ Microgravity. .

Abstract

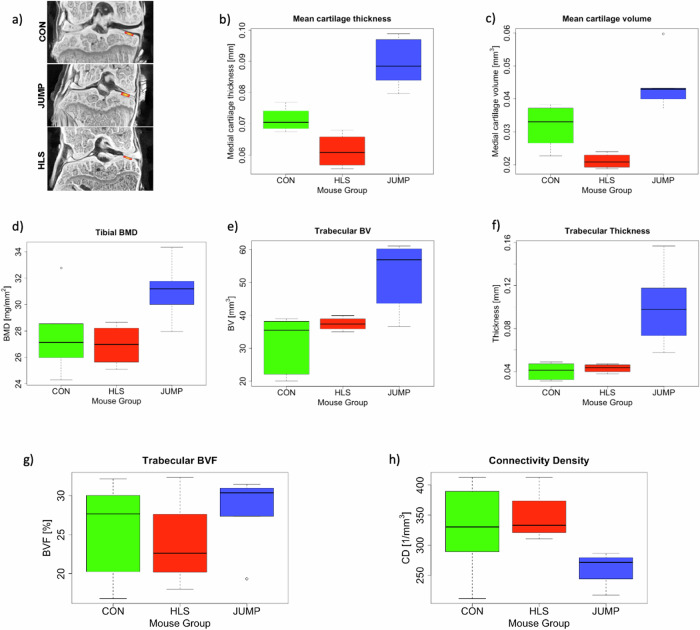
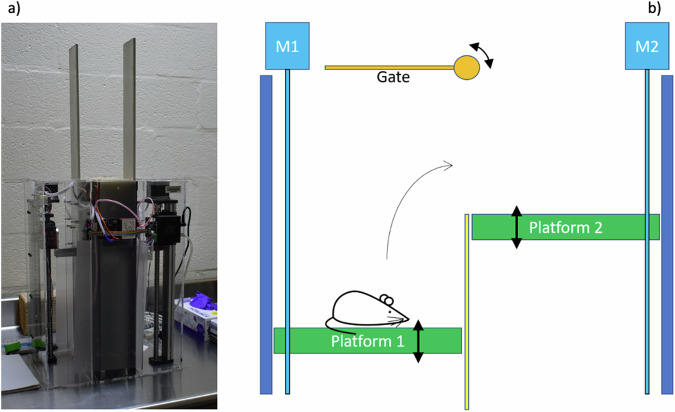
Degeneration and thinning of articular cartilage lead to osteoarthritis and may result from reduced joint loading during e.g. bed rest or as a result of microgravity during space flight. Anabolic physical exercises for cartilage are not well studied to date. We built an experimental apparatus for plyometric training with mice to test potential benefits of jumping for articular cartilage. The exercise group (JUMP) performed jump training for 9 weeks and was compared with sedentary mice (control, CON) and hindlimb-suspended (HLS) mice (to simulate reduced loading) for the same duration. Knee cartilage was assessed via 3-dimensional reconstruction of micro-CT scans and histology. We observed significant thinning and volume reduction of articular cartilage at the medial tibial-femoral point of contact in the HLS group. Clustering of chondrocytes was present in HLS. By contrast, the JUMP group showed both cartilage thickening and volume increase. We observed a similar trend on trabecular bone thickness and volume. Our results show that plyometric training can stimulate cartilage thickness and volume in mice. This suggests further investigation of this mode of exercise as a countermeasure to prevent cartilage atrophy in disuse scenarios such as long duration spaceflight, and for patients at risk of developing osteoarthritis.


Conflict of interest statement

Competing interests: M.S. is an Associate Editor for npj Microgravity. He had no role in the review process for this manuscript. All other authors declare no competing interests.

Figures

Fig. 1
Fig. 1. Schematic of experimental design.
The timeline of the activity of the three mouse groups: control (CON), hindlimb suspended (HLS), and jumping (JUMP) is shown. CON and HLS groups were not subjected to any additional activity. The JUMP group exercised 3 times per week, performing the number of jumps and height indicated in the figure in each session.
Fig. 2
Fig. 2. Average body mass per group during the experiment.
Body mass was measured each week during the experiment. Data points represent the average measure for each group. Group size n is also reported for each group. Standard deviations are plotted as error bars. The measurements in the hindlimb suspended (HLS) group that are statistically different (p < 0.05) from control (CON) are marked with an asterisk.
Fig. 3
Fig. 3. Effect of plyometric training on cartilage and bone structure by micro-CT analysis.
a Representative contrast-enhanced micro-CT images of mouse tibia showing medial tibia-femur contact point (marked in red) where cartilage measurements were taken. bh Boxplots for measurements of cartilage and bone structure parameters are shown in all other panels of the figure. Each of the groups are represented with a box of different colors and the corresponding group name is marked on the x axis of each plot. Control (green, CON, n = 6), jump (blue, JUMP, n = 5), hind limb suspended (red, HLS, n = 4). Each box indicates the interquartile range and whiskers indicate the range of the data, except for outliers which are marked with individual points, where present. Thick horizontal lines inside each box indicate median values for each group. b Mean cartilage thickness was measured in three groups. c Mean cartilage volume measured in all the groups in 200 μm tibial-femur contact point. d Tibial bone mineral density (BMD). e Quantification of trabecular bone volume (BV), f trabecular thickness, g Trabecular bone volume fraction, h Connectivity density.
Fig. 4
Fig. 4. Histological images.
Histological images of representative samples from each of the experimental groups are shown in the figure. The three large images show samples from the three groups: CON (a), HLS (b), JUMP (c). The scale bar is 100 microns, and the scale is the same in all three images. In the bottom right panel we show zoomed-in images to better show the cellular structure inside the black rectangles marked in each of the three groups (a1 for CON, b1 for HLS, c1 for JUMP). Examples of clusters of chondrocytes, mostly present in the HLS group, are marked with yellow circles in panel b1. The size of the zoomed-in images is 0.25 mm × 0.15 mm.
Fig. 5
Fig. 5. The MJ apparatus for mice plyometric training.
a Full view of the MJ apparatus imaged on the lab table during the experiment. In panel b we show the basic mechanism of the apparatus. A mouse is sitting on the lower platform (1) when a green LED light (not shown) turns on. Shortly after that the gate opens and a mild electric shock is applied to the platform. The mouse learns that as soon as the gate opens she should jump onto the higher platform 2. When the mouse reaches platform 2, the gate closes, and the two platforms move (using motors M1 and M2) so that platform 1 is raised and platform 2 is lowered, and the cycle continues for the next jump, until the desired number of jumps is achieved. The platforms are located in the central (dark) part of the machine shown in panel a.
Fig. 6
Fig. 6. Close-up views of the MJ apparatus during standard operations.
a A mouse is sitting on the lower platform as the platform is being moved down by the motor (red box on the right). The upper platform is located on the opposite side of the apparatus (not visible in this figure). b A mouse is sitting on the lower platform as the green LED turns on to signal the incoming shock. The gate to the upper platform is open and the mouse can jump up to the upper platform (visible above the green LED level). See videos of a jump in the Supplementary Videos SV1 and SV2 showing views from the bottom and the top, respectively.
Fig. 7
Fig. 7. Volume of the training protocol per week.
The plot shows the progressive change in exercise volume plotted against the week, from week 1 to 8 (end of the experiment). The volume is calculated as the number of jumps per session (i.e. each training day) multiplied by jump height in cm.

References

    1. Fitzgerald, J. Cartilage breakdown in microgravity—a problem for long-term spaceflight? npj Regen. Med.2, 10 (2017). - PMC - PubMed
    1. Ramkumar, P. N. et al. The Effects of Space Microgravity on Hip and Knee Cartilage: A New Frontier in Orthopaedics. Surg. Tech. Inter.35, 421 (2019). - PubMed
    1. Hardy, J. G. Articular cartilage loss is an unmitigated risk of human spaceflight. npj Microgravity10, 104 (2024). - PMC - PubMed
    1. Ekstein, F., Hudelmaier, M. & Putz, R. The effects of exercise on human articular cartilage. J. Anat.208, 491 (2006). - PMC - PubMed
    1. Liphardt, A.-M. et al. Vibration training intervention to maintain cartilage thickness and serum concentrations of cartilage oligometric matrix protein (COMP) during immobilization. Osteoarthr. Cartil.12, 1598 (2009). - PubMed

LinkOut - more resources