. 2025 Mar;26(5):1212-1237.
doi: 10.1038/s44319-025-00372-1. Epub 2025 Feb 13.

Transcriptional enhancers in human neuronal differentiation provide clues to neuronal disorders

Affiliations

Transcriptional enhancers in human neuronal differentiation provide clues to neuronal disorders

Masahito Yoshihara et al. EMBO Rep. 2025 Mar.

Abstract

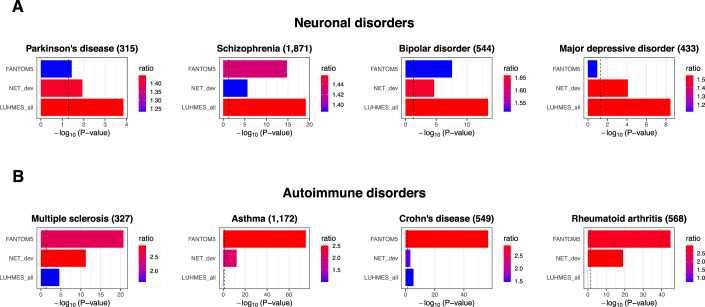
Genome-wide association studies (GWASs) have identified thousands of variants associated with complex phenotypes, including neuropsychiatric disorders. To better understand their pathogenesis, it is necessary to identify the functional roles of these variants, which are largely located in non-coding DNA regions. Here, we employ a human mesencephalic neuronal cell differentiation model, LUHMES, with sensitive and high-resolution methods to discover enhancers (NET-CAGE), perform DNA conformation analysis (Capture Hi-C) to link enhancers to their target genes, and finally validate selected interactions. We expand the number of known enhancers active in differentiating human LUHMES neurons to 47,350, and find overlap with GWAS variants for Parkinson's disease and schizophrenia. Our findings reveal a fine-tuned regulation of human neuronal differentiation, even between adjacent developmental stages; provide a valuable resource for further studies on neuronal development, regulation, and disorders; and emphasize the importance of exploring the vast regulatory potential of non-coding DNA and enhancers.

Keywords: CAGE; Enhancer; Hi-C; LUHMES; Neuron.


Conflict of interest statement

Disclosure and competing interests statement. YM is an inventor on a patent related to the NET-CAGE technology. Other authors declare no competing interests.

Figures

Figure 1
Figure 1. Study design and identification of putative enhancers in LUHMES.
(A) Study design. The human neuronal cell model LUHMES was used to identify promoters by CAGE, putative enhancers by NET-CAGE, and their interactions by Capture Hi-C. (B) Pie chart classifying bidirectionally transcribed loci. In total, 3890 of them overlapped with loci previously identified by the FANTOM5 project or the NET-CAGE development paper (NET_dev). (C) Bar plot showing the numbers of enhancers identified in FANTOM5 phases 1 and 2, NET_dev, and all enhancers combined (FANTOM5 + NET_dev + this study). (D) Pie chart showing the classification of the putative enhancers expressed in LUHMES after filtering out minimally expressed enhancers. Enhancers with log2 [CPM] > −2.5 in at least one sample were retained. As a result, 31,057 of these enhancers were newly identified.
Figure 2
Figure 2. Dynamic changes in promoters and enhancers during LUHMES neuronal differentiation.
(A) Heatmap of differentially expressed promoters during LUHMES differentiation. These promoters were clustered into four groups based on their temporal expression patterns. ‘Total’ refers to total RNA measured by CAGE. S01–S11 indicate sample numbers. (B) Gene ontology (GO) term enrichment analysis of differentially expressed promoters in each cluster. P-values were calculated using the hypergeometric test and adjusted using the Benjamini-Hochberg method. (C) Heatmap of differentially expressed enhancers during LUHMES differentiation. These enhancers were also clustered into four groups based on their temporal expression patterns. ‘Nascent’ refers to nascent RNA measured by NET-CAGE. S01–S11 indicate sample numbers. (D) Heatmap illustrating the proportion of overlap between the promoters nearest to enhancers (row) and promoters (column) in each cluster.
Figure 3
Figure 3. Transcription factor binding motif analysis of promoters and enhancers during LUHMES neuronal differentiation.
(A, B) Heatmap showing the enrichment of transcription factor binding motifs in differentially expressed promoters (A) and enhancers (B) during LUHMES differentiation. The top five significantly enriched motifs in each cluster are shown. P-values were calculated using the binomial test. (C) Z-values indicating transcription factor binding motif activity changes in promoters (x-axis) and enhancers (y-axis) during LUHMES differentiation.
Figure 4
Figure 4. Enrichment of neuronal disorder-associated GWAS SNPs within enhancers active in LUHMES.
Enrichment of GWAS SNPs associated with neuronal (A) or autoimmune disorders (B) in the enhancer regions identified by the FANTOM5 project (65,423), the NET-CAGE development paper (NET_dev; 20,363), and all expressed enhancers in LUHMES (LUHMES_all; 47,350). P-values were calculated using the permutation test. The dashed lines represent P = 0.05. Numbers in parentheses indicate the number of SNPs for each disorder.
Figure 5
Figure 5. The genome interaction landscape of enhancers in LUHMES neuronal cells is significantly altered upon differentiation.
(A) The breakdown of targeted features and the number of interactions for each feature type. DE Enhancer: differentially expressed enhancer. (B) The distribution of interaction distances. Absolute values of the interaction distances are taken, and logarithmic values of the distances are plotted using a bin size of 500 bases. (C) The functional enrichment profile of the distal regions. The first column shows the percentage of overlap between the functional set and the distal interactors. The heatmap on the right shows the fold-enrichment of the distal interactors for the functional set. The full results are found in Dataset EV10. Composite2, composite3, and composite4 correspond to regions where any two, three, or all four functional marks overlap, respectively (except promoters). LUHMES_PE: LUHMES putative enhancers, cCRE: cis-regulatory elements (ENCODE), TF: transcription factor ChIP peaks (Neural), K27Ac: H3K27Ac ChIP peaks, LUHMES_Prom: LUHMES promoters. (D) The extent of interactome changes between differentially expressed (DE) and non-DE promoters across time points. DE genes were more likely to change their interactions compared to non-DE genes, as measured by the overlap coefficient. (E) The interactions of the RET gene across time points. Peaks correspond to those used in the enrichment analysis. The full list can be found in Dataset EV10.
Figure 6
Figure 6. Differentially expressed GWAS enhancers alter their connectivity during LUHMES neuronal differentiation.
(A) Expression levels of interacting features were most strongly correlated at the time point when the interaction was present. P.D1, P.D3, P.D6: promoter expression at Day 1, Day 3, Day 6; E.D1, E.D3, E.D6: NET-CAGE peak expression at Day 1, Day 3, Day 6. (B) Gene ontology (GO) term enrichment of genes interacting with GWAS variants on Day 1 and Day 6 was analyzed separately to assess changes in their target genes. P-values were calculated using the hypergeometric test and adjusted using the Benjamini-Hochberg method. GWAS target genes showed specific and relevant enrichments at different time points. (C) Interaction profile of a differentially expressed TCF4 promoter (highlighted in blue) involving dynamic interactions with a differentially expressed enhancer located 1.2 Mb away (highlighted in yellow) and a GWAS variant associated with schizophrenia (rs1261117, highlighted in gray). Only differentially expressed (DE) promoters and enhancers are displayed in the DE promoter and the DE enhancer tracks. Note that the long-range interaction on Day 1 involves a separate region (~9.3 kb away).
Figure 7
Figure 7. Enhancer–promoter interactions validated by CRISPRa.
Regulation of mRNA levels of the SNCA (A), POU6F2 (B), ZMIZ1 (C), MAP7D1 (D), and PITPNM1 (E) genes measured by qRT-PCR in hTERT-RPE1 cells 24 h after transfection with gRNAs and the dCas9VP192 plasmid. Error bars represent the standard error of the mean, n = 3 independent experiments. Statistical significance was assessed using Dunnett’s multiple comparisons test following a one-way ANOVA. Source data are available online for this figure.
Figure EV1
Figure EV1. Tissue-specific enhancers overlapping with the putative enhancers expressed in LUHMES.
Bar plot showing the number of tissue-specific enhancers identified in the FANTOM5 project that overlap with the putative enhancers expressed in LUHMES. Colors indicate the proportion of specific enhancers in each tissue that overlap with the putative enhancers expressed in LUHMES. Tissues are sorted based on the number of overlapping enhancers.
Figure EV2
Figure EV2. Transcription factors likely to function during LUHMES neuronal differentiation.
(A) Heatmaps showing the expression levels of the promoters of transcription factors whose DNA binding motifs are enriched in the promoters and enhancers of the same cluster. Promoters of transcription factors shown in Fig. 3A, B were investigated. (B) Heatmap showing the enrichment of transcription factor binding motifs in the novel putative enhancer regions (31,057) in LUHMES. P-values were calculated using the binomial test. (C) NEUROD1 ChIP-seq intensity around the novel putative enhancer regions (31,057) and all identified putative enhancers (118,342) using a publicly available dataset.
Figure EV3
Figure EV3. Enrichment of neuronal disorder-associated GWAS SNPs within promoter regions.
Enrichment of GWAS SNPs associated with neuronal (A) or autoimmune disorders (B) in all promoter regions (All; 184,827), promoter regions expressed in LUHMES (Expressed; 52,076), and promoter regions differentially expressed in LUHMES (Differential; 21,907). P-values were calculated using the permutation test. The dashed lines represent P = 0.05. Numbers in parentheses indicate the number of SNPs for each disorder.
Figure EV4
Figure EV4. Conservation and variant analysis of the novel putative enhancer regions.
(A) Box plots showing the distribution of phastCons scores for the novel putative enhancer regions, random coding regions, and random genomic sequences. Each group contains 31,057 regions. The dotted vertical line indicates the median value of the novel putative enhancer regions. ***P < 2.2 × 10⁻¹⁶; Wilcoxon rank sum test. (B) Top: Bar plots showing the number of SNPs overlapping with the novel putative enhancer regions, random coding regions, and random genomic sequences. Bottom: Box plots showing the distribution of log10 [nucleotide diversity (π)] for SNPs overlapping these regions. The dotted vertical line indicates the median value of the novel putative enhancer regions. **P = 1.1 × 10⁻¹⁴, ***P < 2.2 × 10⁻¹⁶; Wilcoxon rank sum test. Center lines in the box plots represent the medians. Box limits indicate 25th and 75th percentiles, while whiskers extend to 1.5 times the interquartile range (IQR) beyond the box limits. Data points outside this range are shown as outliers. (C) Bar plots showing the percentage of SNPs overlapping with the substantia nigra-specific eQTLs in each region. The numbers on the bars indicate the number of SNPs overlapping with these eQTLs. Significant enrichment was observed in the novel putative enhancers compared to the random coding regions (P < 2.2 × 10⁻¹⁶; Fisher’s exact test) and the random genomic sequences (P < 2.2 × 10⁻¹⁶).
Figure EV5
Figure EV5. Characterization of enhancer–promoter interactions.
(A) Heatmap showing the number of interactions between enhancers (row) and promoters (column) belonging to each cluster. (B) Gene Ontology (GO) term enrichment analysis of the 1243 target genes of the enhancers identified in LUHMES. P-values were calculated using the hypergeometric test and adjusted using the Benjamini-Hochberg method.

References

    1. Åkerborg Ö, Spalinskas R, Pradhananga S, Anil A, Höjer P, Poujade F-A, Folkersen L, Eriksson PP, Sahlén P (2019) High-resolution regulatory maps connect vascular risk variants to disease-related pathways. Circ Genom Precis Med 12:e002353 - PMC - PubMed
    1. Alam T, Agrawal S, Severin J, Young RS, Andersson R, Arner E, Hasegawa A, Lizio M, Ramilowski JA, Abugessaisa I et al (2020) Comparative transcriptomics of primary cells in vertebrates. Genome Res 30:951–961 - PMC - PubMed
    1. Amemiya HM, Kundaje A, Boyle AP (2019) The ENCODE blacklist: identification of problematic regions of the genome. Sci Rep. 9:9354 - PMC - PubMed
    1. Andersson R, Gebhard C, Miguel-Escalada I, Hoof I, Bornholdt J, Boyd M, Chen Y, Zhao X, Schmidl C, Suzuki T et al (2014) An atlas of active enhancers across human cell types and tissues. Nature 507:455–461 - PMC - PubMed
    1. Anil A, Spalinskas R, Åkerborg Ö, Sahlén P (2018) HiCapTools: a software suite for probe design and proximity detection for targeted chromosome conformation capture applications. Bioinformatics 34:675–677 - PMC - PubMed

LinkOut - more resources