. 2025 Feb 13;16(1):1610.
doi: 10.1038/s41467-025-56776-z.

Characterising the asynchronous resurgence of common respiratory viruses following the COVID-19 pandemic

Collaborators, Affiliations

Characterising the asynchronous resurgence of common respiratory viruses following the COVID-19 pandemic

Chenkai Zhao et al. Nat Commun. .

Abstract

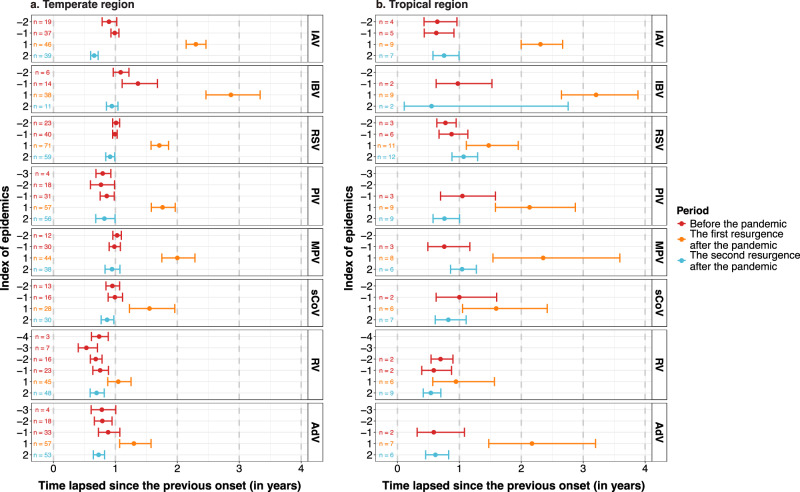
The COVID-19 pandemic and relevant non-pharmaceutical interventions (NPIs) interrupted the circulation of common respiratory viruses. These viruses demonstrated an unprecedented asynchronous resurgence as NPIs were relaxed. We compiled a global dataset from a systematic review, online surveillance reports and unpublished data from Respiratory Virus Global Epidemiology Network, encompassing 92 sites. We compared the resurgence timings of respiratory viruses within each site and synthesised differences in timings across sites, using a generalised linear mixed-effects model. We revealed a distinct sequential timing in the first post-pandemic resurgence: rhinovirus resurged the earliest, followed by seasonal coronavirus, parainfluenza virus, respiratory syncytial virus, adenovirus, metapneumovirus and influenza A virus, with influenza B virus exhibiting the latest resurgence. Similar sequential timing was observed in the second resurgence except influenza A virus caught up with metapneumovirus. The consistent asynchrony across geographical regions suggests that virus-specific characteristics, rather than location-specific factors, determining the relative timing of resurgence.


Conflict of interest statement

Competing interests: T.Z. reports personal fees from Pfizer, outside the submitted work. D.-J.N. reports grants from Wellcome Trust related to the submitted manuscript. C.M.-A. reports personal fees from MSD, Pfizer and Sanofi, and travel grants from MSD and Pfizer, outside the submitted work. J.-W.K. reports grants from Centers for Disease Control and Prevention (CDC) related to the submitted work, grants from National Institutes of Health, Merck Sharp and Dohme Corporation, United States Department of Agriculture, National Science Foundation, CDC and Greenwall Foundation, and participation on data safety monitoring boards for Enhancing the Diabetes Prevention Program to promote weight loss among non-responders in a community based lifestyle intervention funded by National Institute of Diabetes and Digestive and Kidney Diseases, outside the submitted work. J.-M.L. reports that her employer received grants for the conduct of clinical research from Pfizer, GSK, Sanofi, Merck, and Moderna and personal fees paid to her employer from Enanta, GSK and Sanofi. T.H. reports personal fees from MSD, Pfizer and Sanofi, and participation on data safety monitoring boards for Sanofi, Enanta, MSD, Moderna, Shionogi and Pfizer, outside the submitted work. H.N. reports grants from the Innovative Medicines Initiative, WHO, the National Institute for Health Research, Pfizer, and Icosavax; and personal fees from the Gates Foundation, Pfizer, ReViral, GSK, Merck, Icosavax, Sanofi, Novavax, and AbbVie, outside the submitted work. X.W reports grants from GSK and personal fees from Pfizer, outside the submitted work. Y.L. reports grants from WHO, the Wellcome Trust, and GSK, and personal fees from Pfizer, outside the submitted work. All other authors declare no competing interests.

Figures

Fig. 1
Fig. 1. Overview of methodology.
Data were collected from three sources: systematic literature review, online surveillance reports, and the RSV GEN network. The epidemic onset was defined using a “4-week trend” method, where each week’s viral activity (case numbers or positive proportion) was compared to that of four weeks prior. An epidemic onset was identified when four consecutive weeks showed higher activity than their respective weeks four weeks earlier (“up-weeks”). Two approaches were implemented: (1) A descriptive pooling approach that compared intervals between consecutive epidemic onsets of the same virus across sites for both pre- and post-pandemic periods; (2) An analytical matching approach that examined the relative timing differences between pairs of viruses’ resurgence, matched by study site.
Fig. 2
Fig. 2. PRISMA flow diagram.
The diagram shows the screening process of eligible data for analysis.
Fig. 3
Fig. 3. The virus-specific time intervals between epidemics.
a Virus-specific time intervals between epidemic onsets in consecutive years. b Virus-specific time intervals between epidemic peaks in consecutive years. The x-axis represents the time elapsed since the previous onset or peak, measured in years. The left y-axis lists the index of epidemics relative to the onset of the COVID-19 pandemic, with negative numbers indicating epidemics occurring before the pandemic, and positive numbers indicating epidemics occurring after the onset of the pandemic. Data are presented as mean values and error bars indicate their 95% confidence intervals. IAV influenza A virus, IBV influenza B virus, RSV respiratory syncytial virus, PIV parainfluenza virus, MPV metapneumovirus, sCoV seasonal coronavirus, RV rhinovirus, AdV adenovirus. Source data are provided as a Source Data file.
Fig. 4
Fig. 4. The virus-specific time intervals between onsets by region.
a Virus-specific time intervals between epidemic onsets in consecutive years in the temperate region. b Virus-specific time intervals between epidemic onsets in consecutive years in the tropical region. The x-axis represents the time elapsed since the previous onset, measured in years. The left y-axis lists the index of epidemics relative to the onset of the COVID-19 pandemic, with negative numbers indicating epidemics occurring before the pandemic, and positive numbers indicating epidemics occurring after the onset of the pandemic. Data are presented as mean values and error bars indicate their 95% confidence intervals. IAV influenza A virus, IBV influenza B virus, RSV respiratory syncytial virus, PIV parainfluenza virus, MPV metapneumovirus, sCoV seasonal coronavirus, RV rhinovirus, AdV adenovirus. Source data are provided as a Source Data file.
Fig. 5
Fig. 5. The time difference of onset and peak between viruses.
a The time differences in days of onset between viruses during their first and second resurgences, matched by site. b The time differences in days of peak between viruses during their first and second resurgences, matched by site. The matrix presents the pairwise comparison of timing between viruses in their first (shown in blue) and second resurgence (shown in red). Positive [negative] values indicated that the virus on the top/left resurged earlier [later] than the virus on the bottom/right. Dashed line indicated no differences in the timing. Data are presented as mean values and error bars indicate their 95% confidence intervals. IAV influenza A virus, IBV influenza B virus, RSV respiratory syncytial virus, PIV parainfluenza virus, MPV metapneumovirus, sCoV seasonal coronavirus, RV rhinovirus, AdV adenovirus. Source data are provided as a Source Data file.
Fig. 6
Fig. 6. The time difference of onset between viruses by region.
a The time differences in days of onset between viruses during their first and second resurgences, matched by sites in temperate regions. b The time differences in days of onset between viruses during their first and second resurgences, matched by sites in tropical regions. The matrix presents the pairwise comparison of timing between viruses in their first (shown in blue) and second resurgence (shown in red). Positive [negative] values indicated that the virus on the top/left resurged earlier [later] than the virus on the bottom/right. Dashed line indicated no differences in the timing. Data are presented as mean values and error bars indicate their 95% confidence intervals. IAV influenza A virus, IBV influenza B virus, RSV respiratory syncytial virus, PIV parainfluenza virus, MPV metapneumovirus; sCoV seasonal coronavirus, RV rhinovirus, AdV adenovirus. Source data are provided as a Source Data file.

References

    1. GBD 2016 Lower Respiratory Infections Collaborators. Estimates of the global, regional, and national morbidity, mortality, and aetiologies of lower respiratory infections in 195 countries, 1990–2016: a systematic analysis for the Global Burden of Disease Study 2016. Lancet Infect Dis.18, 1191–1210 (2018). - PMC - PubMed
    1. Li, Y. et al. Global patterns in monthly activity of influenza virus, respiratory syncytial virus, parainfluenza virus, and metapneumovirus: a systematic analysis. Lancet Glob. Health7, e1031–e1045 (2019). - PubMed
    1. Li, Y., Campbell, H., Nair, H. & RESCEU Investigators. Unveiling the risk period for death after respiratory syncytial virus illness in young children using a self-controlled case series design. J. Infect. Dis.222, S634–S639 (2020). - PubMed
    1. Moriyama, M., Hugentobler, W. J. & Iwasaki, A. Seasonality of respiratory viral infections. Annu. Rev. Virol.7, 83–101 (2020). - PubMed
    1. Adlhoch, C. et al. Very little influenza in the WHO European region during the 2020/21 season, weeks 40 2020 to 8 2021. Eurosurveillance26, 2100221 (2021). - PMC - PubMed

Publication types

LinkOut - more resources