. 2025 Feb;57(2):466-477.
doi: 10.1038/s12276-025-01403-6. Epub 2025 Feb 13.

Activin E is a new guardian protecting against hepatic steatosis via inhibiting lipolysis in white adipose tissue

Affiliations

Activin E is a new guardian protecting against hepatic steatosis via inhibiting lipolysis in white adipose tissue

Shi-Young Park et al. Exp Mol Med. 2025 Feb.

Abstract

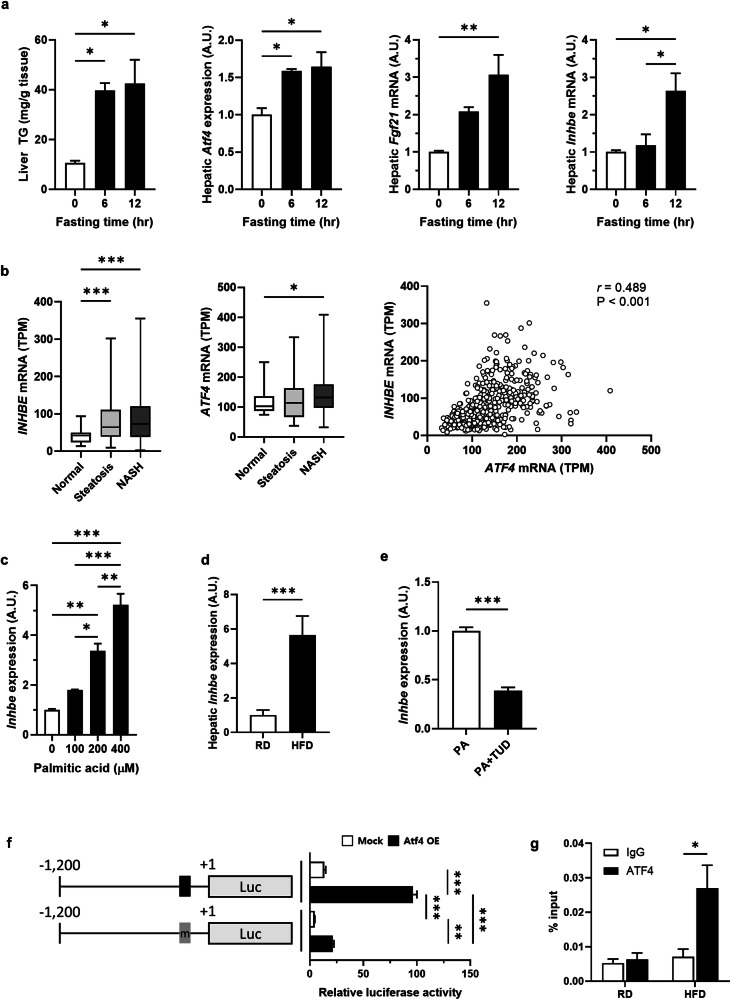
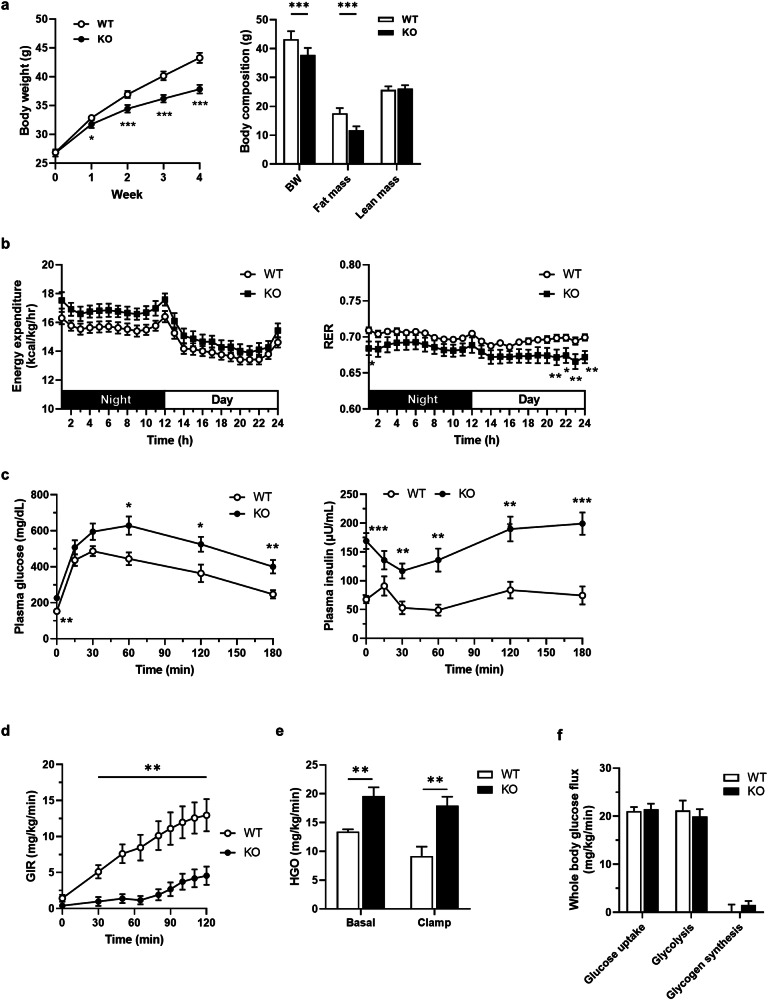
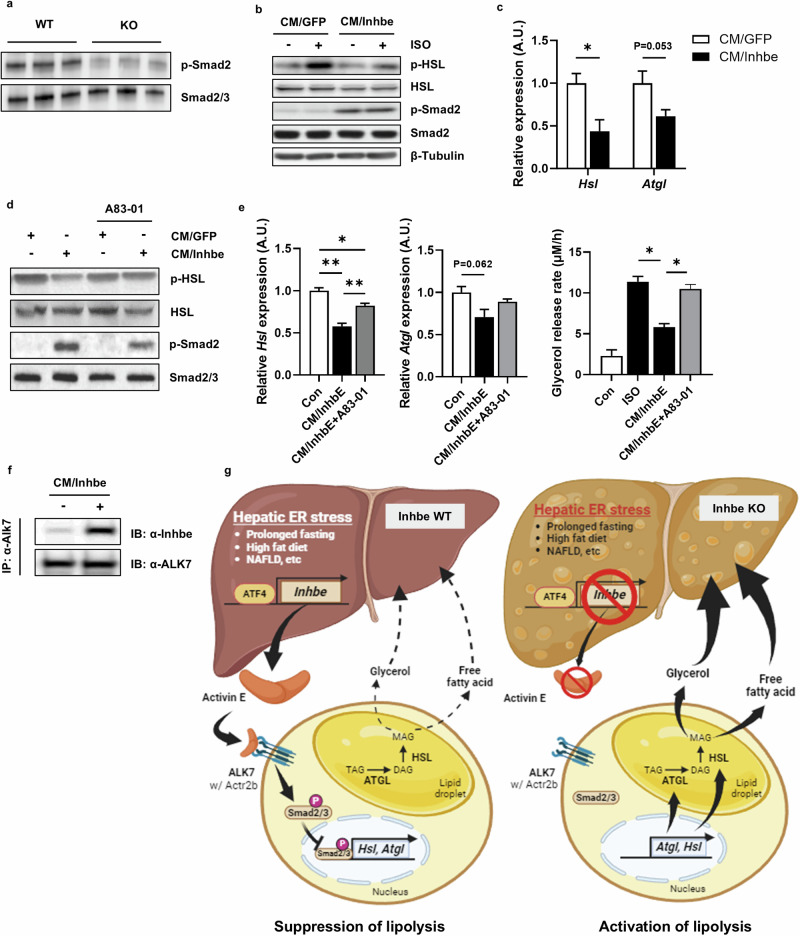
Hepatic endoplasmic reticulum (ER) stress is implicated in the development of steatosis and its progression to nonalcoholic steatohepatitis (NASH). The ER in the liver can sustain metabolic function by activating defense mechanisms that delay or prevent the progression of nonalcoholic fatty liver disease (NAFLD). However, the precise mechanisms by which the ER stress response protects against NAFLD remain largely unknown. Recently, activin E has been linked to metabolic diseases such as insulin resistance and NAFLD. However, the physiological conditions and regulatory mechanisms driving hepatic Inhbe expression (which encodes activin E) as well as the metabolic role of activin E in NAFLD require further investigation. Here we found that hepatic Inhbe expression increased under prolonged fasting and ER stress conditions, which was mediated by ATF4, as determined by promoter analysis in a mouse model. Consistently, a positive correlation between INHBE and ATF4 expression levels in relation to NAFLD status was confirmed using public human NAFLD datasets. To investigate the role of activin E in hepatic steatosis, we assessed the fluxes of the lipid metabolism in an Inhbe-knockout mouse model. These mice displayed a lean phenotype but developed severe hepatic steatosis under a high-fat diet. The deficiency of Inhbe resulted in increased lipolysis in adipose tissue, leading to increased fatty acid influx into the liver. Conversely, hepatic overexpression of Inhbe ameliorated hepatic steatosis by suppressing lipolysis in adipose tissue through ALK7-Smad signaling. In conclusion, activin E serves as a regulatory hepatokine that prevents fatty acid influx into the liver, thereby protecting against NAFLD.


Conflict of interest statement

Competing interests: I.-Y.K. and S.P. are shareholders in Myocare, Inc. The other authors have no conflicts of interest to report.

Figures

Fig. 1
Fig. 1. Inhbe expression is increased by hepatic ER stress under physiological or pathological conditions.
a Liver TG contents and hepatic mRNA expression of Atf4, Fgf21 and Inhbe. Twelve-week-old male C57BL/6J mice were housed under ad libitum, fasted for 6 h or fasted for 12 h (each group, n = 3). b mRNA levels of INHBE and ATF4 in public datasets of RNA-sequencing data from the livers of patients with NAFLD (normal, n = 39; steatosis, n = 179; NASH, n = 260). Gene expression correlation analysis of INHBE and ATF4 in all samples from the datasets (normal + steatosis + NASH, n = 454). c mRNA and protein levels of Inhbe in AML12 hepatocytes treated with 0.4 mM palmitate for 6 h at the indicated concentrations. d mRNA levels of Inhbe in the livers of mice fed a HFD for 4 weeks. e mRNA levels of Inhbe in AML12 cells treated with 0.4 mM palmitate with or without 2 mM tauroursodeoxycholic acid for 6 h. f Luciferase activity in AML12 cells transfected with the 1.2 kb Inhbe WT promoter or the putative ATF4-binding element-deleted promoter under ATF4 overexpression conditions. g Chromatin immunoprecipitation assay with a specific anti-ATF4 antibody and primers for the putative ATF4-binding element in the Inhbe promoter. The data are presented as the mean ± s.e.m. *P < 0.05, **P < 0.01, ***P < 0.001.
Fig. 2
Fig. 2. The Inhbe-KO mouse has a lean but lipodystrophic phenotype.
a Changes in the body weights of the Inhbe WT and KO mice during HFD feeding for 4 weeks (WT, n = 10; KO, n = 10). Body composition of the WT and KO mice after HFD feeding for 4 weeks (WT, n = 10; KO, n = 10). b Energy expenditure and RER values of WT and KO mice after HFD feeding for 2 weeks (WT, n = 13; KO, n = 7). c Plasma glucose and insulin levels of WT and KO mice fed a HFD during the glucose tolerance test (WT, n = 6; KO, n = 8). df Results of hyperinsulinemic–euglycemic clamp after HFD feeding for 4 weeks (WT, n = 5; KO, n = 6): glucose infusion rate (GIR) (d); HGO (e); and whole-body glucose flux (glucose uptake, glycolysis and glycogen synthesis) (f). The data are presented as the mean ± s.e.m. The results presented were analyzed using the Student’s t-test and compared with those of the WT. *P < 0.05, **P < 0.01, ***P < 0.001.
Fig. 3
Fig. 3. The Inhbe-KO mouse has a severe fatty liver phenotype.
a Representative liver image and weight after HFD feeding for 4 weeks (WT, n = 9; KO, n = 10). b Hematoxylin and eosin (H&E) (top) and Oil Red O (bottom) staining of liver tissue. TG contents in the liver tissue (WT, n = 10; KO, n = 10). c A schematic diagram of hepatic steatosis: fat oxidation, VLDL-TG secretion, TG synthesis and fatty acid influx. d The percentage of the 13C-labeled TCA intermediate (citrate, succinate, malate, glutamine and glutamate) fraction (M + 2) normalized by enrichment of plasma palmitate in the liver tissues of the WT and KO mice fed a HFD for 4 weeks (WT, n = 8; KO, n = 5). e Ex vivo fat oxidation rate in the liver tissue (WT, n = 9; KO, n = 9). f VLDL secretion rate. Plasma TAG levels after injection of Poloxamer-407 in WT and KO mice fasted overnight (WT, n = 10; KO, n = 10). g Absolute synthesis rates (ASRs) of TG and DNL rates in liver tissue (WT, n = 10; KO, n = 10). h mRNA levels of genes related to lipid synthesis, oxidation, secretion and uptake in the livers of Inhbe WT and KO mice fed a HFD for 4 weeks (WT, n = 9; KO, n = 10). The data are presented as the mean ± s.e.m. The results presented were analyzed using the Student’s t-test and compared with those of the WT. *P < 0.05, **P < 0.01, ***P < 0.001.
Fig. 4
Fig. 4. Increased lipolysis in adipose tissue causes hepatic fat accumulation in Inhbe-KO mice.
a Free fatty acid levels in the plasma of WT and KO mice fed a HFD for 4 weeks (WT, n = 9; KO, n = 10). b Tissue image and weight of gFat tissue from WT and KO mice (WT, n = 9; KO, n = 10). c H&E staining of gFat tissue and the distribution profile of adipocyte cell size in gFat tissue. d Rates of lipolysis (glycerol Ra, palmitate Ra and intracellular cycling of FFAs) after infusion of D5-glycerol and U-13C16-palmitate in WT and KO mice fed a HFD for 4 weeks (WT, n = 8; KO, n = 8). Ra, rate of appearance. e Western blot analysis of the phosphorylation or expression of HSL and phosphorylated PKA substrates in the gFat tissue of WT and KO mice fed a HFD for 4 weeks. f Relative mRNA expression levels of genes related to lipid metabolism in gFat tissue (WT, n = 9; KO, n = 10). The data are presented as the mean ± s.e.m. The results presented were analyzed using the Student’s t-test and compared with those of the WT. *P < 0.05, **P < 0.01, ***P < 0.001.
Fig. 5
Fig. 5. Activin E suppresses lipolysis in adipocytes via the ALK7–Smad pathway.
a Western blot analysis of the phosphorylation of Smad2 in Inhbe WT and KO mice fed a HFD for 4 weeks. b Western blot analysis for the phosphorylation of HSL in fully differentiated C3H10T1/2 adipocytes treated with conditioned media from cells overexpressing Inhbe with or without 1 μM isoproterenol (ISO). c Relative mRNA expression levels of Hsl and Atgl in fully differentiated C3H10T1/2 adipocytes treated with conditioned media from cells overexpressing Inhbe. d Western blot analysis of the phosphorylation of HSL and Smad2 in fully differentiated C3H10T1/2 adipocytes treated with conditioned media (CM/GFG and CM/Inhbe) from hepatocytes overexpressing Inhbe with or without 1 μM A83-01. e Relative mRNA expression levels of Hsl and Atgl and ISO-induced glycerol release in fully differentiated C3H10T1/2 adipocytes treated with conditioned media from cells overexpressing Inhbe with or without 1 μM A83-01. f Western blot analysis of Inhbe in the cell lysates immunoprecipitated with anti-ALK7 antibody from differentiated C3H10T1/2 adipocytes treated with conditioned media from cells overexpressing Inhbe. IP, immunoprecipitation; IB, immunoblot. g A schematic diagram of the mode of action by which activin E regulates adipose tissue lipolysis (Inhbe WT, left; Inhbe KO, right).
Fig. 6
Fig. 6. Overexpression of activin E improves the fatty liver of Inhbe-KO mice by suppressing lipolysis in adipose tissue.
a Tissue weights of gFat tissue from WT and KO mice fed a HFD for 3 weeks with adenoviral overexpression of Inhbe (WT+Ad/GFP, n = 6; WT+Ad/Inhbe, n = 5; KO+Ad/GFP, n = 8; KO+Ad/Inhbe, n = 9). b Plasma free fatty acid levels in WT and KO mice fed a HFD for 3 weeks with adenoviral overexpression of Inhbe (WT+Ad/GFP, n = 5; WT+Ad/Inhbe, n = 6; KO+Ad/GFP, n = 5; KO+Ad/Inhbe, n = 6). c Relative mRNA expression levels of Hsl and Atgl in gFat tissue from WT and KO mice fed a HFD for 3 weeks with adenoviral overexpression of Inhbe (WT+Ad/GFP, n = 9; WT+Ad/Inhbe, n = 9; KO+Ad/GFP, n = 10; KO+Ad/Inhbe, n = 9). d Liver tissue weights of WT and KO mice fed a HFD for 3 weeks with adenoviral overexpression of Inhbe (WT+Ad/GFP, n = 6; WT+Ad/Inhbe, n = 5; KO+Ad/GFP, n = 9; KO+Ad/Inhbe, n = 8). e Representative H&E staining images of liver tissue from WT and KO mice fed a HFD for 3 weeks with adenoviral overexpression of Inhbe. f TG contents in liver tissue from WT and KO mice fed a HFD for 3 weeks with adenoviral overexpression of Inhbe (WT+Ad/GFP, n = 6; WT+Ad/Inhbe, n = 5; KO+Ad/GFP, n = 7; KO+Ad/Inhbe, n = 9).

References

    1. Riazi, K. et al. The prevalence and incidence of NAFLD worldwide: a systematic review and meta-analysis. Lancet Gastroenterol. Hepatol.7, 851–861 (2022). - DOI - PubMed
    1. Malhi, H. & Kaufman, R. J. Endoplasmic reticulum stress in liver disease. J. Hepatol.54, 795–809 (2011). - DOI - PMC - PubMed
    1. Zhang, X. Q., Xu, C. F., Yu, C. H., Chen, W. X. & Li, Y. M. Role of endoplasmic reticulum stress in the pathogenesis of nonalcoholic fatty liver disease. World J. Gastroenterol.20, 1768–1776 (2014). - DOI - PMC - PubMed
    1. Horwath, J. A. et al. Obesity-induced hepatic steatosis is mediated by endoplasmic reticulum stress in the subfornical organ of the brain. JCI Insight 10.1172/jci.insight.90170 (2017). - PMC - PubMed
    1. Lebeaupin, C., Vallée, D., Hazari, Y., Hetz, C., Chevet, E. & Bailly-Maitre, B. Endoplasmic reticulum stress signalling and the pathogenesis of non-alcoholic fatty liver disease. J. Hepatol.69, 927–947 (2018). - DOI - PubMed

MeSH terms

LinkOut - more resources