. 2025 Feb 14;10(1):54.
doi: 10.1038/s41392-025-02150-w.

Full-length transcriptome atlas of gallbladder cancer reveals trastuzumab resistance conferred by ERBB2 alternative splicing

Affiliations

Full-length transcriptome atlas of gallbladder cancer reveals trastuzumab resistance conferred by ERBB2 alternative splicing

Ziyi Wang et al. Signal Transduct Target Ther. .

Abstract

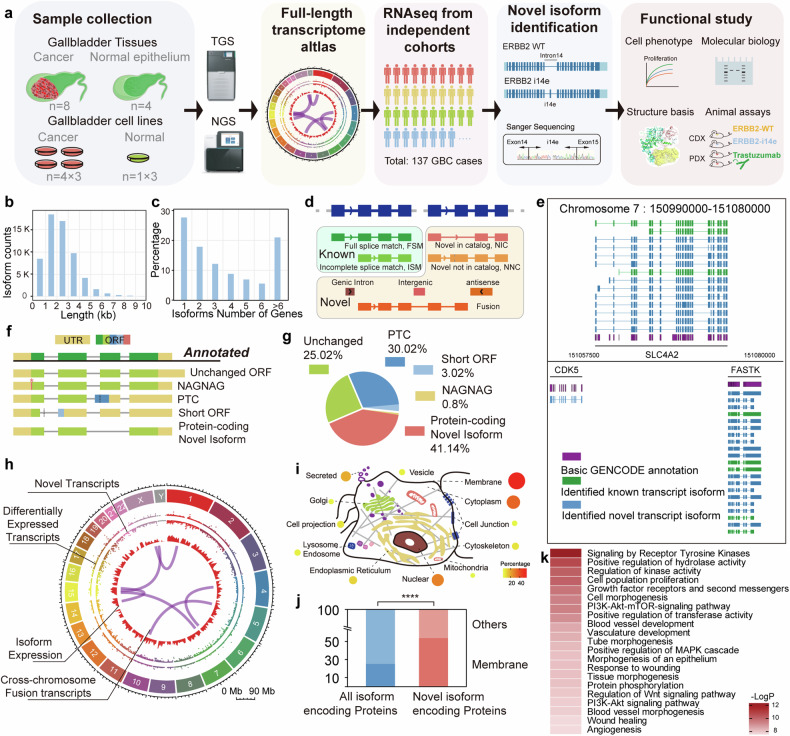
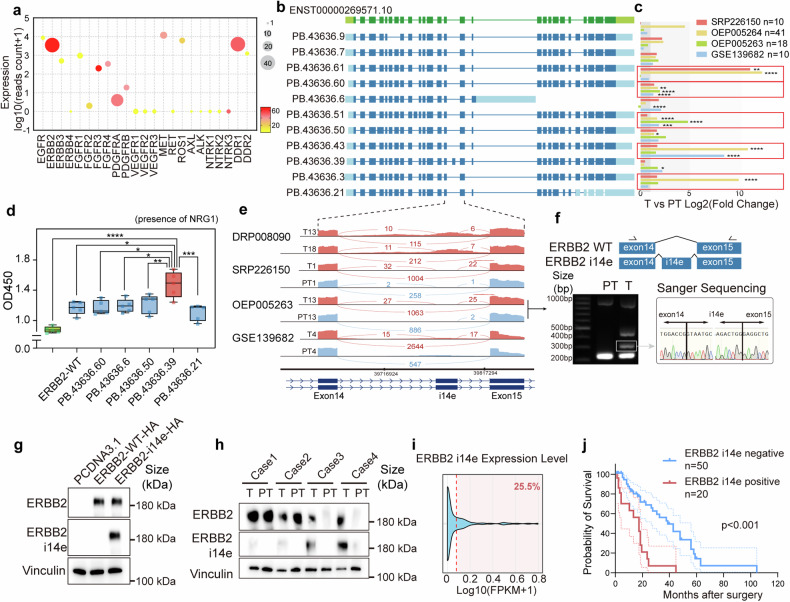
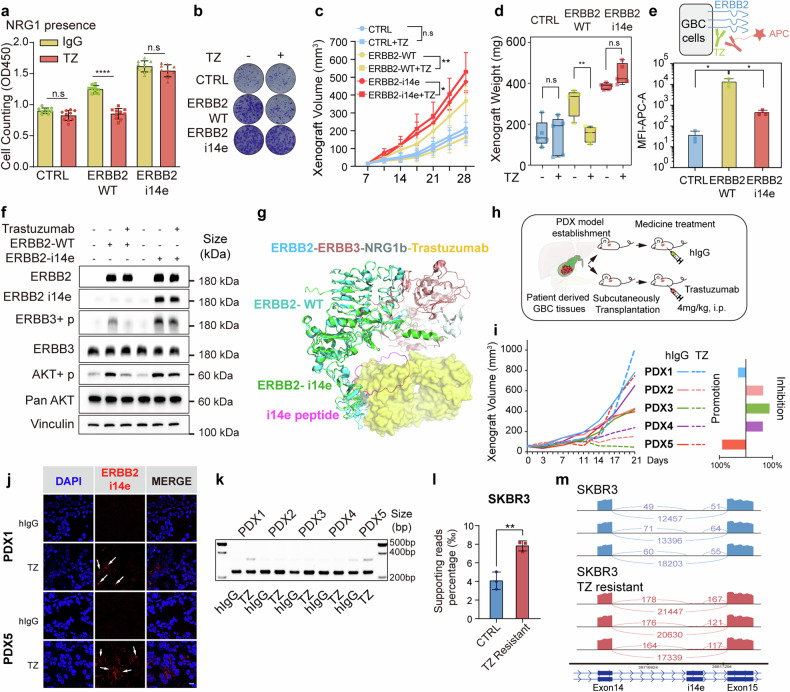
Aberrant RNA alternative splicing in cancer generates varied novel isoforms and protein variants that facilitate cancer progression. Here, we employed the advanced long-read full-length transcriptome sequencing on gallbladder normal tissues, tumors, and cell lines to establish a comprehensive full-length gallbladder transcriptomic atlas. It is of note that receptor tyrosine kinases were one of the most dynamic components with highly variable transcript, with Erb-B2 receptor tyrosine kinase 2 (ERBB2) as a prime representative. A novel transcript, designated ERBB2 i14e, was identified for encoding a novel functional protein, and its protein expression was elevated in gallbladder cancer and strongly associated with worse prognosis. With the regulation of splicing factors ESRP1/2, ERBB2 i14e was alternatively spliced from intron 14 and the encoded i14e peptide was proved to facilitate the interaction with ERBB3 and downstream signaling activation of AKT. ERBB2 i14e was inducible and its expression attenuated anti-ERBB2 treatment efficacy in tumor xenografts. Further studies with patient derived xenografts models validated that ERBB2 i14e blockage with antisense oligonucleotide enhanced the tumor sensitivity to trastuzumab and its drug conjugates. Overall, this study provides a gallbladder specific long-read transcriptome profile and discovers a novel mechanism of trastuzumab resistance, thus ultimately devising strategies to improve trastuzumab therapy.


Conflict of interest statement

Competing interests: The authors declare no conflicts of interests. Ethical approval: Normal gallbladders from organ donors and tissues from patients diagnosed with GBC were collected with signed consent. The request for samples and corresponding clinical data was reviewed and approved by Shanghai Jiao Tong University School of Medicine, Renji Hospital Ethics Committee (KY2020-208; KY2022-182-B; KY2023-065-C). The animal study was reviewed and approved by the Institutional Animal Care and Use Committee of Renji Hospital affiliated to Shanghai Jiao Tong University School of Medicine. All animal experiments complied with ARRIVE guidelines (RJ-2024-029-A).

Figures

Fig. 1
Fig. 1
Establishment of gallbladder-gallbladder cancer transcriptome atlas. a Schematic representation of the research workflow. Transcriptomic atlas of normal gallbladder and gallbladder cancer together with gallbladder cell lines were constructed through sample collection, followed by the second and third-generation sequencing. Datasets of gallbladder cancer transcriptomes were engaged to identify novel transcripts followed by functional and molecular mechanistic studies. b, c Length distribution of detected transcripts and expression profiles of genes on transcript number were displayed. d Re-annotation of transcripts from sqanti3 annotation into “known” and “novel” categories. e Regional landscape of full-length transcriptome in chromosome 7 involving CDK5, SLA4A2 and FASTK. f Five types of transcripts classification based on ORF property by Transuit. ORF open reading frame, PTC premature codon; g Distribution of these five classes among differentially expressed transcripts. h Transcriptomic landscape across chromosomes was displayed, in which inner arcs represented detected inter-chromosomal fusion transcripts. i, j Distribution of protein coding novel isoforms across all cellular compartments. Chi-square test was performed. k Gene Ontology analysis of top-ranked pathways associated with gallbladder cancer tumorigenesis and development
Fig. 2
Fig. 2
Novel ERBB2 i14e identification and clinical characteristics. a Gene expression profile of twenty-three typical receptor tyrosine kinase genes with expression level, total isoform number (size) and novel isoform ratio (color). b Structures of eleven selected ERBB2 novel isoform were displayed. c Five isoforms were upregulated in four independent GBC RNAseq datasets. Wilcoxon rank sum test was performed. d GBC-SD cells transfected with ORF of selected ERBB2 isoforms and subjected CCK8 cell counts (day 7). One-way ANOVA test (n = 5) was performed. Data are presented in box-whisker plot. e Sashimi plots of ERBB2 at exon14-exon15 segmentation for four typical cases from different GBC RNAseq datasets. f Structure of ERBB2 i14e isoform was shown and reverse transcription PCR was performed in one GBC case (T13 and PT13 from OEP005263) with primers (arrows) and the band around 300 bp was extracted and subjected to sanger sequencing. g ERBB2-WT and ERBB2 i14e ORF were transfected into GBC-SD cells and western blot was performed using our house-developed anti-ERBB2 i14e antibody to detect ERBB2 i14e, while the commercial anti-ERBB2 antibody recognized both ERBB2-WT and ERBB2 i14e. h Four pairs of GBCs with para-tumor tissues were collected for protein detection by western blotting. i The distribution of ERBB2 i14e expression was determined using RNAseq data from 137 GBC cases. j Prognostic Kaplan–Meier plot of GBC patients’ survival was shown to be associated with ERBB2 i14e protein expression detected by immunohistochemistry. Log-rank (Mantel-Cox) test was performed. T tumor, PT para-tumor
Fig. 3
Fig. 3
ERBB2 i14e promoted cell proliferation and interact with ERBB3. a GBC-SD cells were transfected with ERBB2 WT, ERBB2 i14e and/or ERBB3 in the presence or absence of NRG1 (100 ng/ml) and then subjected to cell counting assays after 7 days. One-way ANOVA test (n = 5) was performed. Data are presented as mean ± SD. b The difference value between ERBB2 i14e and ERBB2 WT relative to ERBB2 WT was assessed. One-way ANOVA test (n = 5) was performed. Data are presented as mean ± SD. c Clone formation assays were also performed after culture for 14 days. d, e Individual xenograft volume and weight were measured after lentivirus infected GBC-SD cells were subcutaneously planted and 1 μg/ml NRG1 was injected into tumors every three days after day 7. One-way ANOVA test (n = 5) was performed. xenograft volumes are presented as mean ± SD, and xenograft weight are presented in box-whisker plot. f Western blotting on GBC-SD cells transfected with ERBB2 variants and co-cultured with 100 ng/ml NRG1. g Coimmunoprecipitation assays were used to examine the interaction between ERBB2 and ERBB3. h Presumable interaction between ERBB2 i14e and ERBB3 based on the structure PDB 7MN8. i14e peptides (purple) indicated the peptides generated from intron 14 derived exon
Fig. 4
Fig. 4
Cells or tumors expressing ERBB2 i14e were resistant to trastuzumab treatment. a, b Cell proliferation and clone formation of GBC-SD cells expressing ERBB2 wild-type or i14e forms in the presence of 20 μg/ml trastuzumab (TZ) using cell counting assays and clone formation assays. One-way ANOVA test (n = 10) was performed. Data are presented as mean ± SD. c, d Xenografted tumor volume and weight were measured after above GBC-SD cells were subcutaneously planted and 4 mg/kg trastuzumab was intraperitoneally injected twice a week. One-way ANOVA test (n = 5) was performed. Xenograft volumes are presented as mean ± SD and xenograft weight are presented in box-whisker plot. e Flow cytometry assays on GBC-SD cells expressing ERBB2 variants. Cells were treated with trastuzumab and APC-conjugated anti-human IgG antibody to detect the trastuzumab binding. One-way ANOVA test (n = 5) was performed. Data are presented as mean ± SD. f AKT phosphorylation was determined by WB in GBC-SD cells expressing ERBB2 WT or ERBB2 i14e in the presence of 20 μg/ml trastuzumab. g Presumable interaction between ERBB3 and ERBB2 i14e where peptides of i14e prevented binding of trastuzumab to ERBB2. h Patient derived xenografts (PDX) from five gallbladder patients were inoculated into nude mice and trastuzumab was administered intraperitoneally at 4 mg/kg twice a week. i Tumor volume was measured and the inhibition or promotion effects on PDX proliferation were shown on the right panel. j ERBB2 or ERBB2 i14e expression was determined using immunofluorescence in PDX1 and PDX5 tumors. Scale bar is 10 μm. k RT-PCR was also carried out on five PDX samples from Fig. 4i. From GEO dataset (GSE244537), ERBB2 i14e presence was shown by the relative supporting reads ratio in SKRB3 breast cancer control and TZ resistant cells. Two-sided Student’s t test (n = 5) was performed. l and sashimi plots were also exhibited m. TZ trastuzumab, i.p. intraperitoneal injection
Fig. 5
Fig. 5
ERBB2 i14e was generated from ESRP1/2 and inhibited by antisense oligonucleotides. a Differential expression of RNA splicing factors in four independent GBC RNAseq datasets. b The scheme of MiniGene containing ERBB2 exon14 to exon 15 was shown. RT-PCR was performed on GBC-SD cells overexpressing MiniGene when splicing factor expressions were enforced or silenced. c The FPKM values of ESRP1 were calculated in groups with or without ERBB2 i14e expression. Wilcoxon rank sum test was performed. Data are presented in box-whisker plot. d Transcript splicing generating ERBB2 i14e was determined in GBC-SD cells expressing ESRP1 WT or i14R-deleted mutant by RT-PCR after MiniGene plasmids were transfected. e The relative ratio for i14e was calculated and shown. Two-sided student’s t test (n = 3) was performed. Data are presented as mean ± SD. f, g ASOs were designed for corresponding RNA splicing sites and applied to GBC PDO3 before RT-PCR detection. One-way ANOVA test (n = 3) was performed. Data are presented as mean ± SD. h ERBB2, ERBB2 i14e and p-AKT were examined using IHC on paraffin-embedded GBC PDO3. i Proliferation of GBC PDO3 cells was determined by cell-titer-glo assays in the presence of ASOs and trastuzumab. One-way ANOVA test (n = 5) was performed. Data are presented in box-whisker plot. j, k Gallbladder cancer PDXs with high ERBB2 expression were implanted to nude mice and when tumor volume reached 800 mm3, the administration of T-DXd (10 mg/kg, twice a week) was initiated. Four weeks later, vivo-MO (0.2 mM, twice a week) was added to the treatment. The initiation time for each drug was marked in arrow in figures. Vivo-MO: purple; T-DXd: green. Two-sided Student’s t test (n = 3) was performed. Data are presented as mean ± SD. l Schematic representation of ERBB2 i14e generation, trastuzumab resistance and ASO effects. PDO Patient derived organoid, IHC Immunohistochemistry, ASO Antisense oligonucleotides, i.p. intraperitoneal injection, i.t. intra-tumoral injection, SpS Splicing Site, ESE Exonic Splicing Enhancer

References

    1. Roa, J. C. et al. Gallbladder cancer. Nat. Rev. Dis. Prim.8, 69 (2022). - PubMed
    1. Valle, J. W., Kelley, R. K., Nervi, B., Oh, D. Y. & Zhu, A. X. Biliary tract cancer. Lancet397, 428–444 (2021). - PubMed
    1. Song, X. et al. Overview of current targeted therapy in gallbladder cancer. Signal Transduct. Target Ther.5, 230 (2020). - PMC - PubMed
    1. Casaletto, J. B. & McClatchey, A. I. Spatial regulation of receptor tyrosine kinases in development and cancer. Nat. Rev. Cancer12, 387–400 (2012). - PMC - PubMed
    1. Du, Z. & Lovly, C. M. Mechanisms of receptor tyrosine kinase activation in cancer. Mol. Cancer17, 58 (2018). - PMC - PubMed

MeSH terms