. 2025 Mar;44(6):1866-1883.
doi: 10.1038/s44318-024-00330-y. Epub 2025 Feb 13.

Modulation of tumor inflammatory signaling and drug sensitivity by CMTM4

Affiliations

Modulation of tumor inflammatory signaling and drug sensitivity by CMTM4

Yitian Xu et al. EMBO J. 2025 Mar.

Abstract

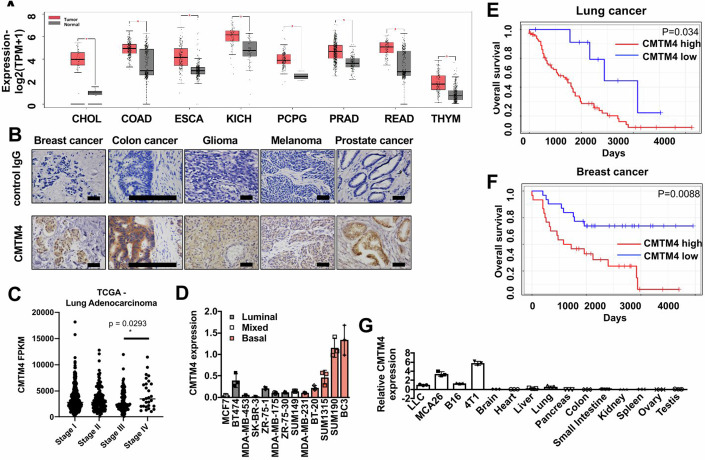
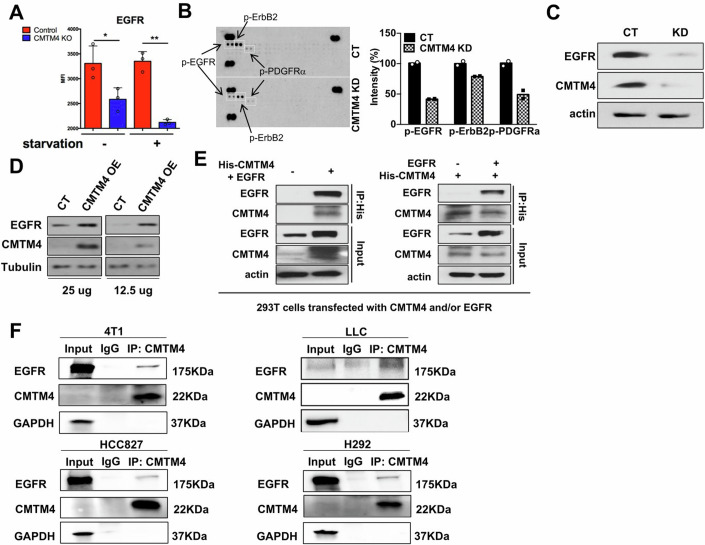
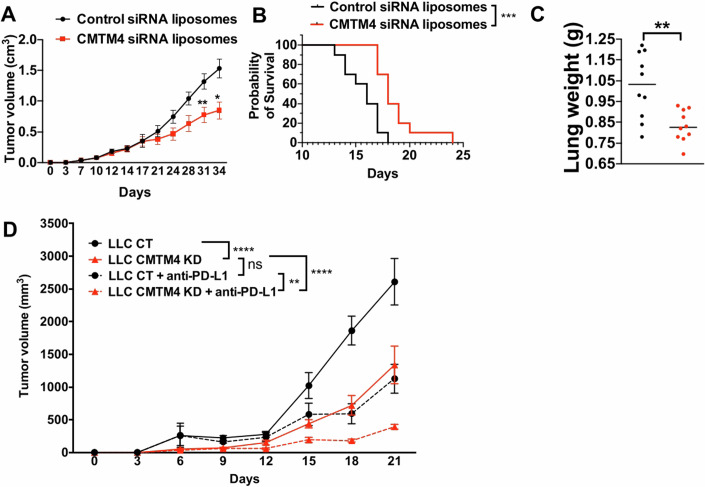
Although inflammation has been widely associated with cancer development, how it affects the outcomes of immunotherapy and chemotherapy remains incompletely understood. Here, we show that CKLF-like MARVEL transmembrane domain-containing member 4 (CMTM4) is highly expressed in multiple human and murine cancer types including Lewis lung carcinoma, triple-negative mammary cancer and melanoma. In lung carcinoma, loss of CMTM4 significantly reduces tumor growth and impairs NF-κB, mTOR, and PI3K/Akt pathway activation. Furthermore, we demonstrate that CMTM4 can regulate epidermal growth factor (EGF) signaling post-translationally by promoting EGFR recycling and preventing its Rab-dependent degradation. Consequently, CMTM4 knockout sensitizes human lung tumor cells to EGFR inhibitors. In addition, CMTM4 knockout tumors stimulated with EGF show a decreased ability to produce inflammatory cytokines including granulocyte colony-stimulating factor (G-CSF), leading to decreased recruitment of polymorphonuclear myeloid-derived suppressor cells (PMN-MDSCs) and therefore establishing a less suppressive tumor immune environment in both lung and mammary cancers. We also present evidence indicating that CMTM4-targeting siRNA-loaded liposomes reduce lung tumor growth in vivo and prolong animal survival. Knockout of CMTM4 enhances immune checkpoint blockade or chemotherapy to further reduce lung tumor growth. These data suggest that CMTM4 represents a novel target for the inhibition of tumor inflammation, and improvement of the immune response and tumor drug sensitivity.

Keywords: CMTM4; Drug Resistance; EGFR; Tumor Microenvironment; Tumor-associated Inflammation.


Conflict of interest statement

Disclosure and competing interests statement. The authors declare no competing interests.

Figures

Figure 1
Figure 1. CMTM4 is highly expressed in human carcinoma samples and is a poor prognostic factor for survival in these patients.
(A) CMTM4 expression in human cancer tissues vs. normal tissues was obtained from TCGA and GTEx databases. CHOL: cholangiocarcinoma (n = 36 for Tumor, n = 9 for normal), COAD: colon adenocarcinoma (n = 275 for Tumor, n = 349 for normal), ESCA: esophageal carcinoma (n = 182 for Tumor, n = 286 for normal), KICH: kidney chromophobe (n = 66 for Tumor, n = 53 for normal), PCPG: pheochromocytoma and paraganglioma (n = 182 for Tumor, n = 3 for normal), PRAD: prostate adenocarcinoma (n = 492 for Tumor, n = 152 for normal), READ: rectum adenocarcinoma (n = 92 for Tumor, n = 318 for normal), THYM: thymoma (n = 118 for Tumor, n = 339 for normal). Box plots show CMTM4 expression at transcripts per million (TPM) in log2-scale. The expression level of CMTM4 ranging from 0 (minimum) to 8 (maximum) across sleeted tumor and normal tissues. Individual boxplots were shown at 95/5 percentile whiskers and 75/25 percentile box bounds with median value at the box center. (B) Paraffin-embedded human carcinoma sections were stained with anti-CMTM4 antibody (40x). scale bars = 50 μm. (C) CMTM4 expression in the different stages of lung adenocarcinoma obtained from TCGA was analyzed. P value calculated by Mann–Whitney test. n = 517. (D) CMTM4 expression in various human breast cancer cell lines was determined by real-time PCR. (E, F) Lung cancer (E, P = 0.034) and breast cancer (F, P = 0.0088) patient data were obtained from dataset GSE26939 and GSE37751, respectively, and divided into CMTM4 high (red) vs. low (blue) expression groups based on median expression values. The Kaplan–Meier plot was drawn based on expression level and correlated with overall survival rates. P value calculated by Log-rank test. (G) CMTM4 expression in murine cancer cell lines and normal tissues was assessed by qRT-PCR analysis. All samples were quantitated and standardized by LLC tumor expression in triplicate with data representing the mean ± SD. Source data are available online for this figure.
Figure 2
Figure 2. CMTM4 knockdown results in a reduction in tumor growth in vivo.
(A) 4T1 control and CMTM4 KO tumors were implanted to the mammary fat pad of Balb/c mice (n = 3). Tumor volume was measured every 7 days. Data representing the mean ± SD. P = 0.024 at Day 23, P < 0.0001 at both Day 27 and Day 30. (B) Control or CMTM4 KD tumor cells were inoculated into the flanks C57BL/6 (B16 or LLC cells) mice (n = 4). Tumor size was measured every 2–3 days. Data representing the mean ± SD. For B16 tumors, P < 0.0001 at both Day 20 and Day 30. For LLC tumors, P < 0.0001 at both Day 18 and Day 21. (C) Control or CMTM4 KO LLC and 4T1 cells were inoculated into C57BL/6 (LLC cells) or BALB/c (4T1) mice (n = 5). Tumor growth was measured every 3–4 days. Data representing the mean ± SD. For LLC tumors, P < 0.0001 at both Day 15 and Day 18. For 4T1 tumors, P = 0.0017 at Day 23, P < 0.0001 at both Day 27 and Day 30. (D) Decreased signaling pathways analyzed by IPA in CMTM4 KD LLC cells compared to control LLC cells. (E) Akt/mTOR signaling was evaluated by western blot in LLC control and CMTM4 KD cells. (F) Phosphorylation of NF-κB in control and CMTM4 KD LLC cells was detected by western blot. (G) Heat-map visualization of normalized DEGs associated with receptor tyrosine kinase (RTK)-related gene expression by CMTM4 KD in LLC cells from RPPA. (H) NF-κB activity was determined in control and CMTM4 KD LLC cells transfected with plasmids carrying pcDNA-CMTM4, STAT5 deleted CMTM4, LZM (leucine-zipper motif) deleted CMTM4, LZM/Traf6 deleted CMTM4, Traf6 dominant-negative mutation (TRAF6 DN) or pcDNA-CMTM4 with TRAF6 DN. Samples were quantitated in triplicate with data representing the mean ± SD. All experiments were repeated twice with similar results. P value calculated by two-way ANOVA test. *P < 0.05. **P < 0.01. ****P < 0.0001. Source data are available online for this figure.
Figure 3
Figure 3. CMTM4 KD in tumor cells leads to decreased expression of receptor tyrosine kinases (RTKs).
(A) EGFR surface expression on H292 human lung cancer cells quantified by flow cytometry. All samples were quantitated in triplicate with data representing the mean ± SD. P values in group without and with starvation are 0.049 and 0.0052, respectively. (B) The phospho-RTK array was performed using control and CMTM4 KD LLC cells and then quantified. N = 2. (C) EGFR expression in LLC cells was determined by western blot. (D) EGFR expression in 293T cells transfected with CMTM4 was determined by western blot. (E) 293T cells were transfected with both His-CMTM4 and EGFR (left panel) or with His-CMTM4 + /− EGFR (right panel). Protein extract was immuno-precipitated with anti-His antibodies, followed by western blot with antibodies against EGFR and CMTM4. (F) 4T1, LLC, H292, or HCC827 cell lines were starved overnight without serum. Protein extract from these cells was immuno-precipitated with anti-CMTM4 antibody, followed by western blot with antibodies against EGFR and CMTM4. P value calculated by Unpaired student t test. *P < 0.05. ***P < 0.001. Source data are available online for this figure.
Figure 4
Figure 4. CMTM4 controls Rab expression to modulate EGFR recycling.
(A) LLC cells were treated with 10 ng/ml EGF overnight and fixed before staining with EGFR and CMTM4. (B) Rab expression in control and CMTM4 KD LLC cells were determined by western blot. (C) Lysate from 293T cells transfected with human CMTM4-Myc with or without Rab21-HA were immuno-precipitated by Myc antibody and blotted by HA antibody. (DF) 293T cells were transfected with CMTM4-EGFP and Rab4-mCherry (D), Rab5-mCherry (E), or Rab11-mCherry (F), and then treated with 10 ng/ml EGF for 1 h. P values are 0.0069, 0.0116 and 0.0253 for (DF), respectively. (G, H) LLC control and CMTM4 KD cells were treated without (G) or with (H) EGF overnight and fixed before staining with EGFR and Lamp-1. P = 0.0061 in (G), and P < 0.0001 for both comparisons in (H). Representative confocal images are shown. Pearson correlation coefficient (PCC) between the GFP channel and mCherry channel was measured from 20 individual cells. P value calculated by Mann–Whitney test. *P < 0.05, **P < 0.01, ****P < 0.0001. Scale bars are 3 μm for (A, C, D) and 5 μm for (B, E, F). Source data are available online for this figure.
Figure 5
Figure 5. CMTM4 regulates Akt/mTOR signaling in human cancer, which is more sensitive to EGFR inhibition when CMTM4 is knockout.
(A) EGFR mutated (over activating) cell line HCC827 was knockout of CMTM4 by CRISPR and Cas9 mRNA or protein. Akt/mTOR signaling was checked by western blot. (B) HCC827 control and CMTM4 KO cells were treated with or without 0.125 μM Gefitinib and tumor cell growth was measured by Incucyte. n = 5. Data representing the mean + SD. Two-way ANOVA test. P value between WT and KO with genfitinib treatment is < 0.0001. (C) HCC827 control and CMTM4 KO cells were all treated with 0.125 μM Gefitinib, with or without 10 μM CQ. Tumor cell growth was measured by Incucyte. n = 5. Data representing the mean + SD. Two-way ANOVA test. P value between KO without CQ and KO with CQ is <0.0001. P value between WT without CQ and KO without CQ is 0.0009. (D) HCC827 control and CMTM4 KO tumors were implanted subcutaneously to NSG mice (n = 7) and treated with or without 150 mg/kg Gefitinib at Day 21 and Day 24. Data representing the mean ± SD. Two-way ANOVA test. P value between WT and KO with genfitinib treatment is <0.0001 at Day 53 and Day 59. P values at the last two time-points are <0.0001. **P < 0.01. ****P < 0.0001. Experiments were repeated twice with similar result. Source data are available online for this figure.
Figure 6
Figure 6. CMTM4 regulates inflammatory mediators by activating EGFR signaling, which recruits immunosuppressive MDSCs.
(A) LLC control and CMTM4 KD cells were treated with 10 ng/ml EGF for 2 days. G-CSF production was measured by ELISA. All samples were quantitated in duplicate with data representing the mean ± SD. n = 4. P values are 0.001 and <0.0001 without and with EGF stimulation, respectively. (B, C) LLC control and CMTM4 KD cells were cultured in the presence of 10 ng/ml EGF for 48 h. Cytokine arrays (B) were performed with supernatants from control and CMTM4 KD LLC cell cultures and results were quantified (C). n = 2. (DF) Control or CMTM4 KD LLC cells were subcutaneously inoculated into C57BL/6 mice (n = 3). Once tumors reached greater than 1 × 1 cm2, mice with similarly sized tumors were sacrificed and bone marrow, spleen, and tumor tissues were harvested. (D) Single-cell suspensions were prepared from bone marrow, spleen, and tumor tissues and subjected to FACS analysis. Cell suspensions were gated on CD45+CD11b+ cells. The number of MDSCs from each tumor was determined in the right panel. Samples were quantitated in triplicate with data representing the mean ± SD. P value is 0.0075 for PMN-MDSC. (E) Expression of M1-like markers (MHC II, CD64, CD80, TNF-α) and M2-like marker (Relm-α) on TILs from LLC control and CMTM4 KD tumors displayed on t-SNE map by CyTOF analysis (upper panel). Mean metal intensity of these markers were quantified in lower panel. Samples were quantitated in triplicate with data representing the mean ± SD. P values are 0.022 and 0.030 for CD80 and Relm-α. (F) Tumor-infiltrating T cell populations were assessed by FACS analysis (upper) and the number of T cells in the tumor tissues was calculated (lower). Samples were quantitated in triplicate with data representing the mean ± SD. P = 0.0465 for CD8 T cells, P = 0.0495 for CD4 T cells, P = 0.0819 for Treg cells. P value calculated by unpaired Student t test. *P < 0.05, **P < 0.01. The data shown are representative of three reproducible experiments. Source data are available online for this figure.
Figure 7
Figure 7. Targeting CMTM4 inhibited tumor growth and metastasis, promoted animal survival and synergized with immune checkpoint blockade.
(A) Tumor cells were subcutaneously inoculated into flank of mice (n = 10) and control or CMTM4 siRNA liposomes were injected intratumorally every 3 days starting at day 7. Tumor growth was measured every 3–4 days. Samples were quantitated with data representing the mean ± SD. Two-way ANOVA test. P = 0.0095 at Day 31 and P = 0.015 at Day 34. (B, C) Tumor cells were intravenously injected into mice (n = 10) and control or CMTM4 siRNA liposomes were injected intravenously every 3 days starting at day 7. Data representing the mean ± SD. (B) Animal survival was plotted as Kaplan–Meier curves. Log-rank test. P = 0.0008. (C) Lung weight was measured from animals that received control or CMTM4 siRNA liposomes. Unpaired t test. P = 0.0027. (D) LLC control and CMTM4 KD tumors were implanted subcutaneously in C57BL/6 mice (n = 7). 200 ug IgG control or PD-L1 antibody was injected into the animals every 3 days. P = 0.029 for LLC control and CMTM4 KD tumors treated with PD-L1. P < 0.0001 for both comparisons between LLC control and CMTM4 KD tumors without PD-L1 treatment, and between LLC CMTM4 KD tumors with and without PD-L1 treatment. Data representing the mean ± SD. Two-way ANOVA test. P < 0.0001. *P < 0.05. **P < 0.01. ***P < 0.01. ****P < 0.0001. Experiments were repeated twice with similar results. Source data are available online for this figure.

References

    1. Abbosh C, Birkbak NJ, Wilson GA, Jamal-Hanjani M, Constantin T, Salari R, Le Quesne J, Moore DA, Veeriah S, Rosenthal R et al (2017) Phylogenetic ctDNA analysis depicts early-stage lung cancer evolution. Nature 545:446–451 - PMC - PubMed
    1. Almand B, Clark JI, Nikitina E, van Beynen J, English NR, Knight SC, Carbone DP, Gabrilovich DI (2001) Increased production of immature myeloid cells in cancer patients: a mechanism of immunosuppression in cancer. J Immunol 166:678–689 - PubMed
    1. Barbieri MA, Fernandez-Pol S, Hunker C, Horazdovsky BH, Stahl PD (2004) Role of rab5 in EGF receptor-mediated signal transduction. Eur J Cell Biol 83:305–314 - PubMed
    1. Burnett SH, Kershen EJ, Zhang J, Zeng L, Straley SC, Kaplan AM, Cohen DA (2004) Conditional macrophage ablation in transgenic mice expressing a Fas-based suicide gene. J Leukoc Biol 75:612–623 - PubMed
    1. Burr ML, Sparbier CE, Chan YC, Williamson JC, Woods K, Beavis PA, Lam EYN, Henderson MA, Bell CC, Stolzenburg S et al (2017) CMTM6 maintains the expression of PD-L1 and regulates anti-tumour immunity. Nature 549:101–105 - PMC - PubMed

MeSH terms