. 2025 Mar;17(3):535-562.
doi: 10.1038/s44321-025-00197-4. Epub 2025 Feb 13.

Portimine A toxin causes skin inflammation through ZAKα-dependent NLRP1 inflammasome activation

Affiliations

Portimine A toxin causes skin inflammation through ZAKα-dependent NLRP1 inflammasome activation

Léana Gorse et al. EMBO Mol Med. 2025 Mar.

Abstract

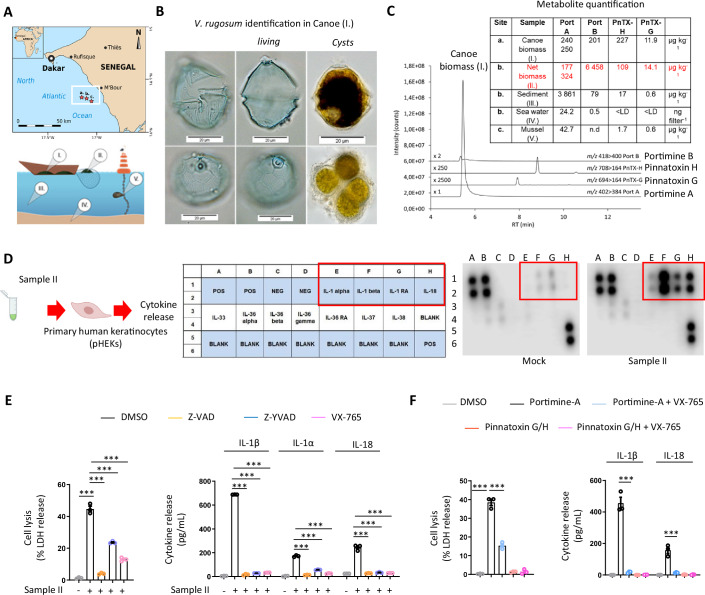
In 2020-2021, a "mysterious illness" struck Senegalese fishermen, causing severe acute dermatitis in over one thousand individuals following exposure through drift-net fishing activity. Here, by performing deep analysis of the environmental samples we reveal the presence of the marine dinoflagellate Vulcanodinium rugosum and its associated cyclic imine toxins. Specifically, we show that the toxin PortimineA, strongly enriched in environmental samples, impedes ribosome function in human keratinocytes, which subsequently activates the stress kinases ZAKα and P38 and promotes the nucleation of the human NLRP1 inflammasome, leading to the release of IL-1β/IL-18 pro-inflammatory cytokines and cell death. Furthermore, cell-based models highlight that naturally occurring mutations in the P38-targeted sites of human NLRP1 are unable to respond to PortimineA exposure. Finally, the development and use of human organotypic skins and zebrafish models of PortimineA exposure demonstrate that the ZAKα-NLRP1 axis drives skin necrosis and inflammation. Our results exemplify the threats to human health caused by emerging environmental toxins and identify ZAKα and NRLP1 as important pharmacological targets to mitigate PortimineA toxicity.

Keywords: Environmental Toxins; NLRP1 Inflammasome; Ribotoxic Stress Response; Skin Pathology.


Conflict of interest statement

Disclosure and competing interests statement. The authors declare no competing interests.

Figures

Figure 1
Figure 1. Vulcanodinium rugosum-produced Portimine A triggers human skin epithelial cell necrosis and IL-1 cytokine release.
(A) Map of the Senegalese coast showing the location of the outbreak and the sampling sites i.e., red star (a) (14.33 N; −17.15 W), (b) (14.32 N; −17.10 W) and (c) (14.29 N; −17.05 W). Samples from different environmental compartments: (I) biomass from fishing canoe, (II) biomass from fishing drift-net, (III) GF/F filtered seawater, (IV) marine sediment, (V) mussel flesh. (B) Light microscopy images of Vulcanodinium rugosum (sample I, 2020): living cells and temporary cysts. (C) LC-MS/MS chromatogram of toxin profile (sample I, 2020) and chemical structures of Portimine A and Pinnatoxin H and concentrations of V. rugosum toxins in the samples I–V, quantified by LC-MS/MS. N.B. All mussel (c) data are from 2021. PnTX: Pinnatoxin, Port: Portimine. (D) Cytokine analysis 24 h after exposure of primary human keratinocytes (pHEKs) to purified extracts derived from Sample II isolated in (C, red), diluted 1/20,000. Representative experiment of three independent replicates. (E) Quantification of cell lysis (LDH) and IL-1α, IL-1β, or IL-18 release in pHEKs treated with Sample II (1/20,000) for 24 h. When specified, the pan-caspase inhibitor (Z-VAD, 20 µM), Caspase-1 inhibitors (Z-YVAD, 20 µM or VX-765, 10 µM) were used. ***P ≤ 0.0001, two-way ANOVA with multiple comparisons. Values are expressed as mean ± SEM. Graphs show one experiment performed in triplicates at least three times. (F) Cell lysis (LDH) and IL-1β or IL-18 release evaluation in pHEKs upon pure Portimine A (4 ng/mL) or Pinnatoxins-H/G (40 ng/mL) exposure for 24 h. When specified, the -caspase inhibitor (Z-VAD, 20 µM), Caspase-1 inhibitors (Z-YVAD, 20 µM or VX-765, 10 µM) were used. ***P ≤ 0.0001, two-way ANOVA with multiple comparisons. Values are expressed as mean ± SEM. Graphs show one experiment performed in triplicates at least three times. Source data are available online for this figure.
Figure 2
Figure 2. Portimine A activates the NLRP1 inflammasome in human skin epithelial cells.
(A) Fluorescence micrographs and associated quantifications of ASC-GFP specks in HEK293T cells individually expressing or not NLRP1, NLRP3, NLRP10 or AIM2 exposed to 4 ng/mL of Portimine A for 8 h. ASC-GFP (green) pictures were directly taken after adding Hoechst (nuclei staining). Images shown are from one experiment and are representative of n = 3 independent experiments. Scale bar, 10 µm. The percentage of ASC complex was performed by determining the ratios between cells positive for ASC speckles and the total of cell nuclei (Hoechst). At least ten fields from each experiment were analyzed. Values are expressed as mean ± SEM. ***P ≤ 0.0001, one-way ANOVA. (B) Immunoblotting characterization of the NLRP1 genetic knockdown (CRISPR-Cas9) and of the subsequent cell lysis (LDH) and IL-1β release in pHEKs exposed or not to Sample II (1/20,000 dilution), Portimine A (4 ng/mL), ValboroPro (VbP, 10 µM) or Anisomycin (1 µM) for 24 h. For Cell lysis and cytokine release, ***P ≤ 0.0001, two-way ANOVA with multiple comparisons. Values are expressed as mean ± SEM. Immunoblot is one experiment representative of three independent experiments. Graphs show one experiment performed in triplicates at least three times. (C) Fluorescence micrographs and associated quantifications of ASC specks in pHEKs and NLRP1-deficient pHEKs generated in (B) and exposed or not to Portimine A (4 ng/mL) for 24 h. Hoechst (nuclei staining), ASC (anti-ASC antibody, green). Images shown are from one experiment and are representative of n = 3 independent experiments. Scale bar, 10 µm. The percentage of ASC complex was performed by determining the ratios between cells positive for ASC speckles and the total of cell nuclei (Hoechst). At least ten fields from each experiment were analyzed. Values are expressed as mean ± SEM. ***P ≤ 0.0001, one-way ANOVA. (D) Immunoblotting of GSDMD, GSDME, Caspase-3, NLRP1 (C-term part) and tubullin in pHEKs and NLRP1-deficient pHEKs (generated in (B)) after 24 h exposure to Portimine A (4 ng/mL) or to the known RSR inducer Anisomycin (1 µg/mL). Immunoblots show lysates from one experiment performed at least two times. (E) Cell lysis (LDH) and IL-1β release evaluation in pHEKs and NLRP1-deficient pHEKs upon pure Portimine A (4 ng/mL) or Anisomycin (1 µg/mL) exposure for 24 h. When specified, the Caspase-3 inhibitor (Z-DEVD, 20 µM) was used. ***P ≤ 0.0001, two-way ANOVA with multiple comparisons. Values are expressed as mean ± SEM. Graphs show one experiment performed in triplicates at least three times. Source data are available online for this figure.
Figure 3
Figure 3. Portimine-inhibited translation promotes ZAKα-dependent P38 activation and hNLRP1 inflammasome activation in epithelial cells.
(A) Determination of protein synthesis in HEK293 cells expressing or not NLRP1 in response to Sample II (1/20,000 dilution), Portimine A (4 ng/mL), Portimine B (400 ng/mL), or Pinnatoxins-H/G (40 ng/mL) by measuring puromycin incorporation after 2 h exposure. Immunoblots show lysates from one experiment performed at least three times. (B) Schematic representation of the mechanism of ZAKα/P38 stress kinases activation upon induction of Ribotoxic Stress Response (RSR). Phosphotag blotting of phosphorylated ZAKα in pHEK cells exposed to Sample II (1/20,000 dilution), Portimine A (4 ng/mL), Portimine B (400 ng/mL), or the known RSR inducer Anisomycin (1 µg/mL) for 8 h. When specified, PLX420 (b-Raf, ZAKα inhibitor, 10 µM) was used. Immunoblots show lysates from one experiment performed at least three times. (C) Phosphotag blotting of phosphorylated ZAKα, P38 and NLRP1 disordered Region (DR) in NTERT NLRP1 KO + 86-275-SNAP (described in Fig. EV3D) cells exposed to Portimine A (20 or 80 ng/mL) or to the known RSR inducer Anisomycin (1 µg/mL) for an hour. When specified, 6p (ZAKα inhibitor, 1 µM) was used. Ponceau staining and GAPDH were used as internal protein loading controls. Immunoblots show lysates from one experiment performed at least two times. (D) Immunoblotting of P38, ZAKα, Tubulin, and phosphorylated P38, plasma membrane permeabilization (SYTOX Green incorporation, 6 h) and IL-1β release evaluation (24 h) in pHEKs WT or genetically invalidated (CRISPR-Cas9) for ZAKα 8 h after exposure to Portimine A (4 ng/mL) or the known RSR inducer Anisomycin (1 µg/mL). ***P ≤ 0.0001, one-way ANOVA. Values are expressed as mean ± SEM. Graphs show one experiment performed in triplicates at least three times. (E) Fluorescence microscopy and associated quantifications of ASC-GFP specks in A549ASC-GFP reporter cells expressing or not NLRP1 exposed to 4 ng/mL of Portimine A or to 1 µg/mL of Anisomycin for 6 h. When specified, SB 203580 (P38α/β inhibitor, 10 µM) was used. ASC-GFP (green) pictures were directly taken in dish after adding Hoechst (nuclei staining). Images shown are from one experiment and are representative of three independent experiments; scale bars, 10 µm. ASC complex percentage was performed by determining the ratios of cells positive for ASC speckles on the total nuclei (Hoechst). At least ten fields from each experiment were analyzed. Values are expressed as mean ± SEM. ***P ≤ 0.0001, one-way ANOVA. (F) Western blot showing NLRP1 using an anti-NLRP1 N-terminal antibody (aa 1–323) in HEK293ASC-GFP reporter cells reconstituted with hNLRP1 or hNLRP1 plasmid constructs mutated (S107F and DelP108_T112) after 6 h exposure to Portimine A (4 ng/mL) or after 10 h exposure to Val-boro-Pro (VbP, 10 µM). Images shown are from one experiment and are representative of three independent experiments. (G) Fluorescence micrographs and respective quantifications of ASC-GFP specks in HEK293ASC-GFP reporter cells reconstituted with hNLRP1 or hNLRP1 plasmid constructs mutated for S107F and DelP108_T112 after 6 h exposure to Portimine A (4 ng/mL) or after 10 h exposure to Val-boro-Pro (VbP, 10 µM). ASC-GFP (green) pictures were taken in the dish after toxin exposure. Images shown are from one experiment and are representative of three independent experiments; scale bars, 10 µm. ASC complex percentage was performed by determining the ratios of cells positive for ASC speckles (green, GFP) on the total nuclei (Hoechst). At least ten fields from three independent experiments were analyzed. Values are expressed as mean ± SEM. ***P ≤ 0.0001, two-way ANOVA with multiple comparisons. Graphs show one experiment performed in triplicate at least three times. Source data are available online for this figure.
Figure 4
Figure 4. ZAKα and NLRP1 contribution to Portimine-induced skin inflammation in 3D skin and zebrafish models.
(A) Representative diagram indicating the experimental approach in the WT and ZAKα-deficient 3D skin model of Portimine exposure. (B) Hemalun (H) & Eosin (E) staining showing ZAKα-dependent histological changes caused by PortimineA (20 nM) exposure. Yellow arrows show epidermidis alterations/damages induced by Portimine A. Associated quantification of the dermal–epidermal layer detachment of 3D skin. P values indicated in figure, one-way ANOVA. Images are representative of three biological replicates. Scale bar = 50 µm. (C) IL-1α, β, and -18 cytokine analysis in 3D skin treated or not with Portimine A (A, B). Results are from a total of 65 cytokine analysis presented in Fig. EV4A. P values indicated in figure, one-way ANOVA. (D) Survival curves of zebrafish larvae (20 larvae/group) incubated with various concentrations of Portimine A. Graph shows a representative experiment out of the three performed. P values indicated in figure, Log-Rank (Mantel–Cox) test. (E) Determination of skin necrosis induced by Portimine A (25 nM) in the caudal fin of zebrafish larvae by measuring the incorporation of the plasma membrane impairment probe SYTOX Green after 24 h exposure in area delimited by dashed white line. In total, 20–30 larvae/group were compared and quantified. Values are expressed as mean. P values indicated in figure, one-way ANOVA. Scale bar 100 µm. Graphs show one experiment performed three times. (F) Determination and quantification of zebrafish larvae fin tail gross damage induced by Portimine A (25 nM) in WT and Nlrp1- and ZAKa-deficient larvae (20/group) at the indicated time points. Scale bar 100 µm. Specific quantifications and statistical analysis are provided in experiments that measure tail area presented Fig. EV4B,D. Graphs show one experiment performed two times. (G) Determination and quantification of zebrafish neutrophil recruitment to the fin tail in WT and Nlrp1- and ZAKa-deficient larvae (20/group) of the zebrafish line Tg(LysC:GFP)^nz117 with GFP-expressing neutrophils over 24 h exposure to Portimine A (75 ng/mL). Graph shows a representative experiment out of the two performed. Values are expressed as mean. P values indicated in figure, one-way ANOVA (Kruskal–Wallis test). Scale bar 100 µm. Graphs show one experiment performed two times. Source data are available online for this figure.
Figure EV1
Figure EV1. (refers to Fig. 1): Vulcanodinium rugosum-produced Portimine A triggers human skin epithelial cell necrosis and IL-1 cytokine release.
(A) Amplification results of qPCR assay including derivative melting curves plot and amplification curves plot. The qPCR analysis was performed in duplicate. The melting temperature (Tm) was calculated to be 80.3 °C for the strain and sample and the cycle threshold was of 24 and 31 cycles, respectively. (B) Cytokine analysis 24 h after exposure of primary human keratinocytes (pHEKs) to purified extracts (Sample II isolated in Fig. 1C, dilution 1/20,000 from the isolated fraction). Representative experiment of three independent experiments. (C) Cytotoxicity of Pinnatoxin H and -G, Portimine A and -B pHEK. 24 h treatment, n = 3, mean ± SEM. (D) Cytotoxicity of extracts from V. rugosum cultures (IFR-VRU-01) and biomass sampled in Senegal (2020) on pHEK, expressed as PortimineA equivalent concentrations (determined by LC-MS/MS), 24 h treatment, n = 3, mean ± SEM. (E) Cell lysis (LDH) evaluation in pHEKs after 30 h exposure to Sample II, pure Portimine A (1,7 ng/mL, calculated from Sample II IC50 in D), Portimine B (1,7 ng/mL, calculated from Sample II IC50 in D), pure 400 ng/mL Pinnatoxin H and -G or combinations of all those toxins by always keeping a final concentration of 1.7 nM of Portimine A or Poritmine B in the different mixtures generated. ***P ≤ 0.0001, two-way ANOVA with multiple comparisons. Values are expressed as mean ± SEM. Graphs show one experiment performed in triplicates at least three times. (F) Plasma membrane permeabilization (SYTOX Green incorporation, 9 h) in pHEKs after exposure to Sample II (1/20,000), Portimine A (4 ng/mL), Portimine B (400 ng/mL) or Pinnatoxin G/H (40 ng/mL). ***P ≤ 0.0001, two-way ANOVA with multiple comparisons. Values are expressed as mean ± SEM. Graphs show one experiment performed in triplicates at least three times. (G) SYTOX Green incorporation in pHEKs, primary human endothelial, nasal, monocytes, lymphocytes or neutrophils cells 6 h after exposure to Portimine A (4 ng/mL) or Portimine B (4 ng/mL). ***P ≤ 0.0001, two-way ANOVA with multiple comparisons. Values are expressed as mean ± SEM. Graphs show one experiment performed in triplicates at least three times.
Figure EV2
Figure EV2. (refers to Fig. 2): Portimine A activates the NLRP1 inflammasome in human skin epithelial cells.
Fluorescence micrographs of ASC-GFP specks in HEK293T cells individually expressing NLRP1 and exposed to 4 ng/mL of Portimine A, 400 ng/mL of Pinnatoxin H/G or to 4 ng/mL or 400 ng/mL of Portimine B for 12 h. ASC-GFP (green) pictures were directly taken after adding Hoechst (nuclei staining). Images shown are from one experiment and are representative of n = 3 independent experiments. Scale bar, 10 µm.
Figure EV3
Figure EV3. (refers to Fig. 3): Portimine-inhibited translation promotes ZAKα-dependent P38 activation and hNLRP1 inflammasome activation in epithelial cells.
(A) Determination of protein synthesis in pHEKs in response to Sample II (1/20000 dilution), Portimine A (4 ng/mL) or Pinnatoxins-H/G (40 ng/mL) by measuring puromycin incorporation after 10 h exposure. Immunoblots show lysates from one experiment performed at least three times. (B) Ribosome profiling and ribosomal fraction analysis after exposing HEK293 cells expressing or not NLRP1 to Portimine A (4 ng/mL) for 2 h. Images and Immunoblotting are representatives of one experiment performed at least three times. (C) In vitro translation of the reporter plasmid coding for Interleukin 33 (IL-33) by rabbit reticulocyte lysates in the presence/absence of Sample II (1/20,000 dilution), Portimine A (4 ng/mL), Anisomycin (1 µg/mL). Immunoblotting are representatives of one experiment performed at least three times. (D) Phosphotag blotting of phosphorylated ZAKα, P38, JNK and NLRP1 disordered Region (DR) in NTERT NLRP1 KO + 86-275-SNAP cells exposed to various amounts of Portimine A or to the known RSR inducer Anisomycin (1 µg/mL) for one hour. Ponceau staining and GAPDH were used as internal protein loading controls. Immunoblots show lysates from one experiment performed at least two times. (E, F) Phosphotag blotting of phosphorylated P38 and cell lysis (LDH) evaluation in pHEKs, endothelial cells, nasal basal cells and human blood monocytes after 24 h exposure to pure Portimine A (4 ng/mL) or Anismoycin (1 µg/mL and 10 µg/mL in monocytes). When specified the compounds PLX4720 (ZAKα, 10 µM), Emricasan (pan Caspase inhibitor, 5 µM) and bortezomib (proteasome inhibitor, 1 µM) were used. ***P ≤ 0.0001, two-way ANOVA with multiple comparisons. Values are expressed as mean ± SEM. Graphs show one experiment performed in triplicates at least three times.
Figure EV4
Figure EV4. (refers to Fig. 4): ZAKα and NLRP1 contribution to Portimine-induced skin inflammation in 3D skin and zebrafish models.
(A) 65 cytokine analyzed in 3D skin treated or not with Portimine A. (B) Determination and quantification of zebrafish larvae fin tail damage induced by Portimine A (75 nM) in WT larvae (20/group). Two specific parameters were studied for damages quantifications, namely the Tail area (×105 µm2) and the % of damage severity. Scale bar 100 µm. P values indicated in figure, one-way ANOVA (Kruskal–Wallis test). Graphs show one experiment performed three times. (C) CRISPR/Cas9 gRNA strategy used to genetically ablate ZAKα, NLRP1 and Asc in zebrafish embryo (for details see material and methods). (D) Determination and quantification of zebrafish larvae fin tail damage induced by Portimine A (75 nM) in WT, Nlrp1-, Asc- and ZAKa-deficient larvae (20/group) after 30 h. P values indicated in figure, one-way ANOVA (Kruskal–Wallis test). Scale bar 100 µm. Graphs show one experiment performed two times.

References

    1. Abadie E, Chiantella C, Crottier A, Rhodes L, Masseret E, Berteaux T, Laabir M (2018) What are the main environmental factors driving the development of the neurotoxic dinoflagellate Vulcanodinium rugosum in a Mediterranean ecosystem (Ingril lagoon, France)? Harmful Algae 75:75–86 - PubMed
    1. Arnette C, Koetsier JL, Hoover P, Getsios S, Green KJ (2016) In vitro model of the epidermis: connecting proteinfunction to 3D structure. Methods Enzymol 569:287 - PMC - PubMed
    1. Ball DP, Tsamouri LP, Wang AE, Huang HC, Warren CD, Wang Q, Edmondson IH, Griswold AR, Rao SD, Johnson DC et al (2022) Oxidized thioredoxin-1 restrains the NLRP1 inflammasome. Sci Immunol 7:eabm7200 - PMC - PubMed
    1. Bauernfried S, Scherr MJ, Pichlmair A, Duderstadt KE, Hornung V (2021) Human NLRP1 is a sensor for double-stranded RNA. Science 371:eabd0811 - PubMed
    1. Berdalet E, Fleming LE, Gowen R, Davidson K, Hess P, Backer LC, Moore SK, Hoagland P, Enevoldsen H (2015) Marine harmful algal blooms, human health and wellbeing: challenges and opportunities in the 21st century. J Mar Biol Assoc UK 2015:61–91 - PMC - PubMed

LinkOut - more resources