. 2025 Feb 13;8(1):230.
doi: 10.1038/s42003-025-07631-w.

Electrolyte and metabolite composition of cystic fluid from a rat model of ARPKD

Affiliations

Electrolyte and metabolite composition of cystic fluid from a rat model of ARPKD

Christine A Klemens et al. Commun Biol. .

Abstract

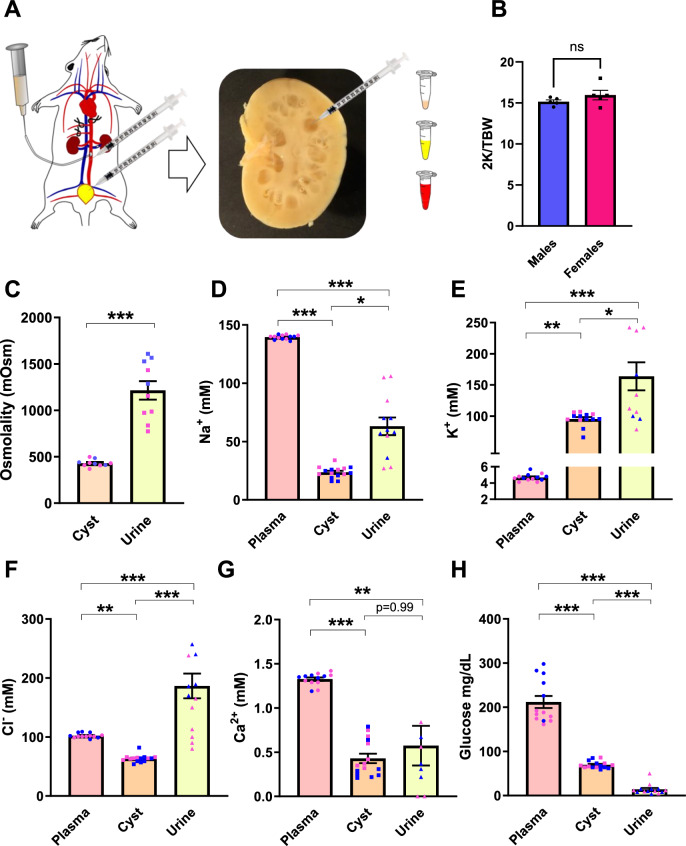
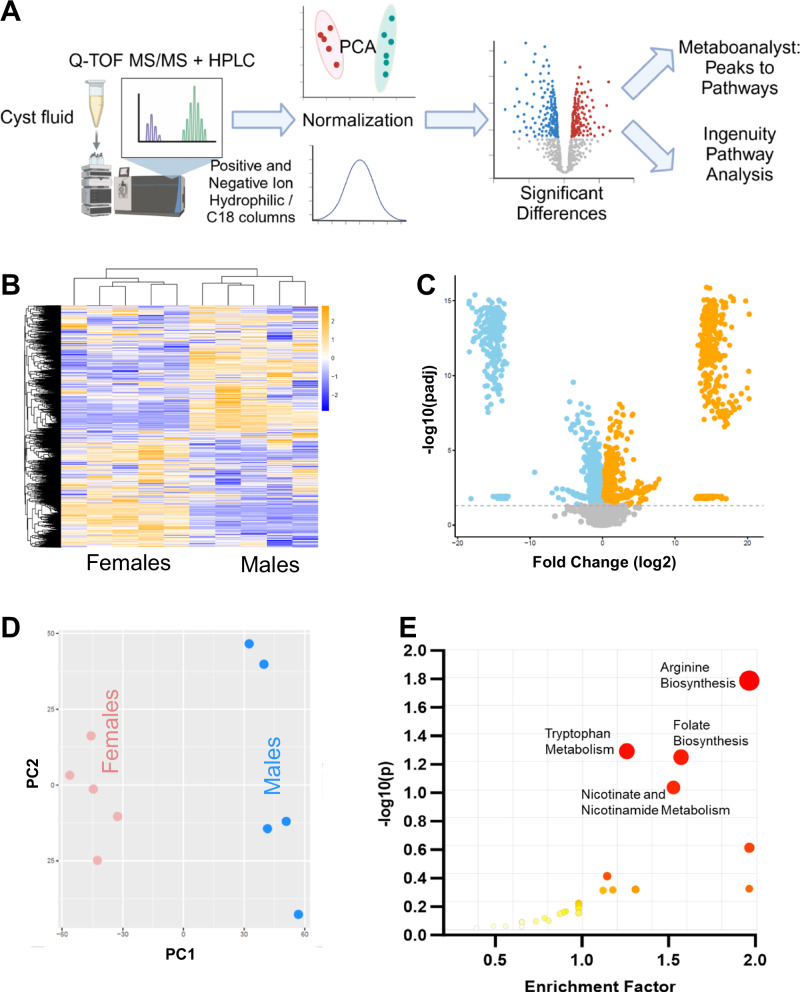
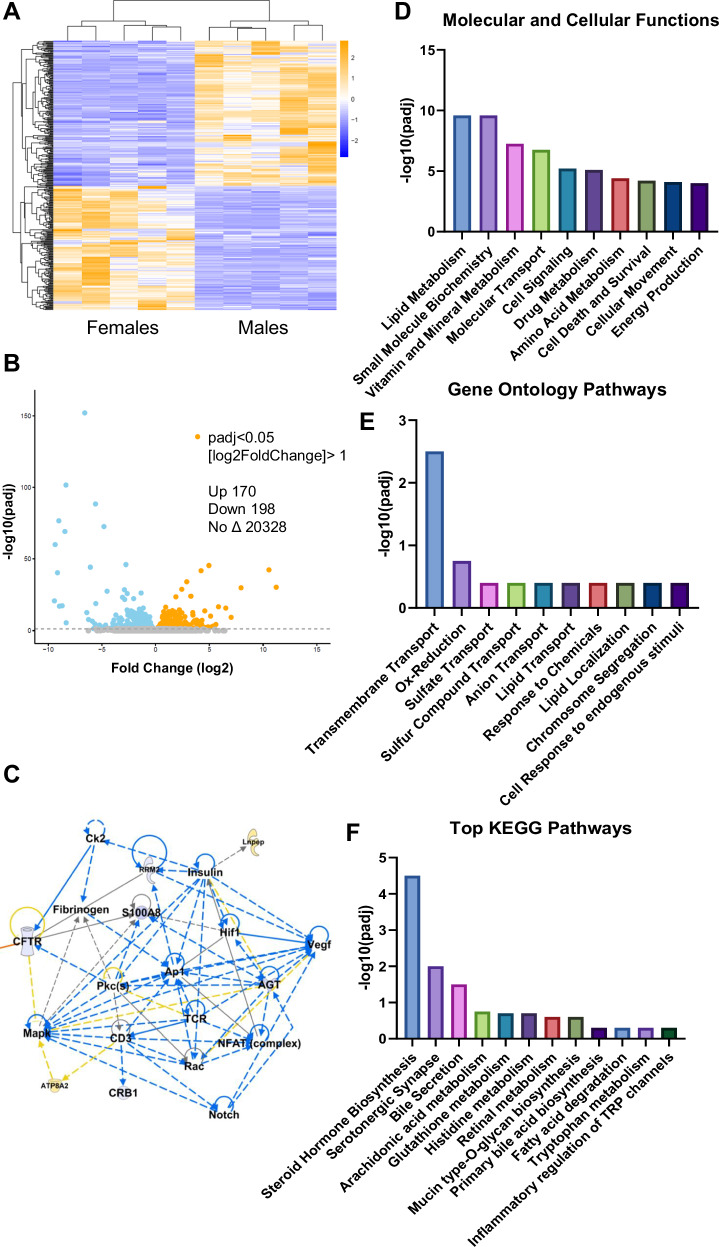
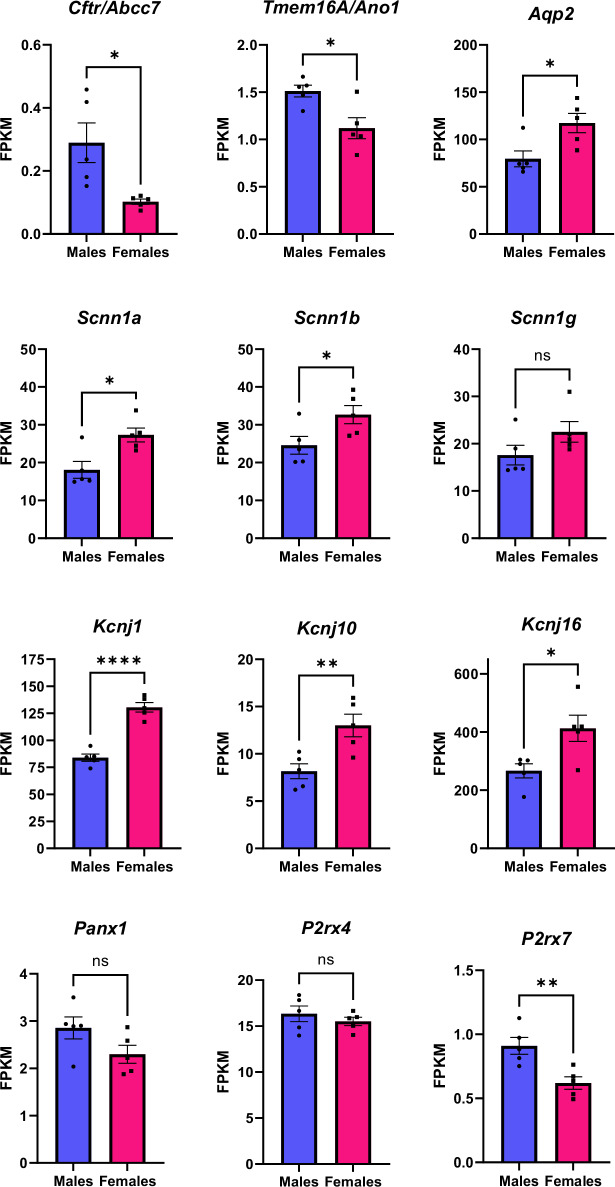
Fluid-filled cysts are the key feature of polycystic kidney disease, which eventually leads to renal failure. We analyzed the composition of cyst fluid from a rat model of autosomal recessive polycystic kidney disease, the PCK rat, and identified sexual differences. Our results demonstrate that the ion composition of cyst fluid differs from that of urine or plasma. Untargeted metabolomics combined with transcriptomic data identified tryptophan metabolism, enzyme metabolism, steroid hormone biosynthesis, and fatty acid metabolism as pathways differing between male and female PCK rats. We quantified 42 amino acids in the cyst fluid (PCK only), plasma, and urine of male and female PCK rats and Sprague Dawley rats. Taurine was the most concentrated amino acid present in the cyst fluid, and PCK rat urinary taurine excretion was over 3-fold greater than Sprague Dawley rats. Understanding the composition of cyst fluid provides valuable insights into disease pathophysiology and may help identify potential dietary or pharmacological interventions to mitigate disease progression and improve patient outcomes.


Conflict of interest statement

Competing interests: The authors declare no competing interests.

Figures

Fig. 1
Fig. 1. Cyst fluid collection and electrolyte composition.
A Male and Female (10–12 weeks-old) PCK rat kidneys were flushed with PBS, sectioned, and cyst fluid was immediately carefully aspirated from intact cysts and snap-frozen. Blood from the abdominal aorta and urine directly from the bladder were also collected. B There is no significant difference in 2 kidney/total body weight ratios (2 K/TBW) at the collected age. C Cyst and Urine osmolalities (D) Na+ concentrations (E) K+ concentrations (F) Cl concentrations (G) Ca2+ concentrations (H) Non-fasted glucose concentrations. Individual male (blue) and female (pink) data points are shown in each graph. Significance was determined by unpaired t-test (2 K/TBW, Osmolality) or Brown-Forsythe and Welch ANOVA with Dunnet’s correction p < 0.05 considered significant. N ≥ 5 rats. Graphs demonstrate the mean ± SEM. *p < 0.05 **p < 0.01 ***p < 0.001.
Fig. 2
Fig. 2. Untargeted metabolomics of male and female cyst fluid.
A Experimental Approach. B Heatmap showing fold change differences for individual animals from the -C18 column results. C Volcano plot showing compounds that were significantly increased (orange) or decreased (blue) in females with a log2fold change (FC) > 1 with p-adjusted value < 0.05 as determined by differential expression analysis R-package DEseq2. D Principal Component Analysis (PCA) plot multivariate analysis showing clustering of male and female results. E Enrichment analysis of cyst fluid metabolic pathways that were significantly different between groups. N = 6 male and 6 female rats.
Fig. 3
Fig. 3. RNA-seq analysis of male and female PCK rat kidney.
A Heatmap showing fold change differences for different animals. B Volcano plot of significantly up (orange) or down (blue) differentially expressed genes in females with a log2fold change (FC) > 1 and p-adjusted value < 0.05 as determined by differential expression analysis R-package DEseq2. C Signaling network demonstrating down-regulation of pathway-related genes including Vegf, Notch, Hif1a, and Cftr in females. Top Molecular and Cellular Functions (D), Gene Ontology Pathways (E), and KEGG Pathways (F) that are predicted to be different between male and female PCK kidney. N = 5 male and 5 female rats.
Fig. 4
Fig. 4. Differentially expressed ion channel genes expressed in the collecting duct.
Cftr and Tmem16A encode chloride channels: cystic fibrosis transmembrane regulator (CFTR) and the calcium-activated chloride channel Anoctamin. Aqp2 is the gene that transcribed aquaporin 2. Scnn1a, Scnn1b, and Scnn1g encode the α, β, and γ subunits of the epithelial Na+ channel (ENaC), respectively. Kcnj1, Kcnj10, and Kcnj16 encode the inward-rectifying K+ channels: ROMK, Kir4.1 and Kir5.1. Panx1, P2rx4, and P2rx7 transcribe an ATP-releasing channel (Pannexin1) and Ca+ transporting ionic purinergic receptors P2X4 and P2X7. Significance was determined by unpaired two-tailed t-test with p < 0.05 considered significant. Graphs demonstrate the mean ± SEM. *p < 0.05 **p < 0.01 ***p < 0.001. KPKM - Fragments Per Kilobase per Million mapped fragments. N = 5 male and 5 female rats.
Fig. 5
Fig. 5. Joint pathway analysis of metabolomics dataset with RNAseq dataset.
A Enrichment analysis of metabolic pathways resulting from the identification of significantly different cyst fluid metabolites paired with differentially expressed genes in male and female PCK rat kidneys. Larger y-axis coordinates correspond to a greater number of significantly different metabolites from a pathway. A larger x-axis coordinates result from increased numbers of significantly different genes in a pathway. Major pathways predicted to be different after combining both metabolite and gene expression include: tryptophan metabolism, drug metabolism, steroid hormone biosynthesis, fatty acid metabolism, caffeine metabolism, drug metabolism by cytochrome p450, purine metabolism, metabolism of xenobiotics by cytochrome p450, linoleic metabolism, and tyrosine metabolism. Also, of note are # - amino sugar and nucleotide sugar metabolism, & - arginine and proline metabolism, and * - taurine and hypotaurine metabolism. B Schematic of the 3 major arms of tryptophan metabolism. Compounds in yellow boxes are significantly different between male and female cyst fluid. C Graphs showing significant differences in several genes associated with tryptophan metabolism signaling. Graphs demonstrate the mean ± SEM. Significance was determined by unpaired two-tailed t-test *p < 0.05 **p < 0.01 ***p < 0.001. KPKM - Fragments Per Kilobase per Million mapped fragments.
Fig. 6
Fig. 6. Targeted metabolomic assay to quantify amino acid concentrations present in cystic fluid.
A Quantification of amino acids used as building blocks for proteins. B Quantification of non-proteinogenic amino acids. Box plots demonstrate the mean amino acid concentrations. Both male and female values are included in the average (N = 12). Values were determined via mass spectroscopy of cyst fluid compared against known standards. Taurine is the most abundant amino acid present in cystic fluid. Graph y-axis are the same scale for easy comparison of relative abundance. N = 6 male and 6 female rats.
Fig. 7
Fig. 7. Taurine concentrations.
A Comparison of taurine concentrations between plasma, cyst fluid, and urine. B Comparisons of taurine concentration sex differences. Taurine was significantly reduced in female plasma and cyst fluid. C Summary of taurine plasma levels in age-matched Sprague Dawley (SD) rats and PCK rats. D Graph of urinary taurine concentrations in SD or PCK rats. There were no significant differences in plasma or urine taurine concentrations in SD rats. Individual male (blue) and female (pink) data points are shown in each graph, mean ± SEM. N = 6 male and 6 female rats. Significance was determined by Brown-Forsythe and Welch ANOVA with Dunnet’s correction for multiple comparisons (A) or unpaired t-test (BD) *p < 0.05, **p < 0.01, ***p < 0.001, ***p < 0.0001.

Similar articles

Cited by

References

    1. Lanktree, M. B. et al. Prevalence estimates of polycystic kidney and liver disease by population sequencing. J. Am. Soc. Nephrol.29, 2593–2600 (2018). - PMC - PubMed
    1. Dicks, E. et al. Incident renal events and risk factors in autosomal dominant polycystic kidney disease: a population and family-based cohort followed for 22 years. Clin. J. Am. Soc. Nephrol.1, 710–717 (2006). - PubMed
    1. Gabow, P. A. et al. Factors affecting the progression of renal disease in autosomal-dominant polycystic kidney disease. Kidney Int.41, 1311–1319 (1992). - PubMed
    1. Fick-Brosnahan, G. M., Belz, M. M., McFann, K. K., Johnson, A. M. & Schrier, R. W. Relationship between renal volume growth and renal function in autosomal dominant polycystic kidney disease: a longitudinal study. Am. J. Kidney Dis.39, 1127–1134 (2002). - PubMed
    1. Orskov, B., Christensen, K. B., Feldt-Rasmussen, B. & Strandgaard, S. Low birth weight is associated with earlier onset of end-stage renal disease in Danish patients with autosomal dominant polycystic kidney disease. Kidney Int.81, 919–924 (2012). - PubMed

LinkOut - more resources