Comparative Study
. 2025 Mar;57(3):572-582.
doi: 10.1038/s41588-025-02085-6. Epub 2025 Feb 13.

Comparative analysis of the Mexico City Prospective Study and the UK Biobank identifies ancestry-specific effects on clonal hematopoiesis

Affiliations
Comparative Study

Comparative analysis of the Mexico City Prospective Study and the UK Biobank identifies ancestry-specific effects on clonal hematopoiesis

Sean Wen et al. Nat Genet. 2025 Mar.

Abstract

The impact of genetic ancestry on the development of clonal hematopoiesis (CH) remains largely unexplored. Here, we compared CH in 136,401 participants from the Mexico City Prospective Study (MCPS) to 416,118 individuals from the UK Biobank (UKB) and observed CH to be significantly less common in MCPS compared to UKB (adjusted odds ratio = 0.59, 95% confidence interval (CI) = [0.57, 0.61], P = 7.31 × 10-185). Among MCPS participants, CH frequency was positively correlated with the percentage of European ancestry (adjusted beta = 0.84, 95% CI = [0.66, 1.03], P = 7.35 × 10⁻¹⁹). Genome-wide and exome-wide association analyses in MCPS identified ancestry-specific variants in the TCL1B locus with opposing effects on DNMT3A-CH versus non-DNMT3A-CH. Meta-analysis of MCPS and UKB identified five novel loci associated with CH, including polymorphisms at PARP11/CCND2, MEIS1 and MYCN. Our CH study, the largest in a non-European population to date, demonstrates the power of cross-ancestry comparisons to derive novel insights into CH pathogenesis.


Conflict of interest statement

Competing interests: S. Wen, F.H., A.N., I.T., S.V.V.D., H.T., K.R.S., K.C., D.P.L., O.S.B., R.S.D., S. Wasilewski, Q.W., S.P., M.A.F., A.R.H., J.M. are current employees and/or stockholders of AstraZeneca. R.C. is the chair of the data monitoring committee of the PROMINENT trial and the deputy chair of a not-for-profit clinical trial company (PROTAS) unrelated to this work. The other authors declare no competing interests.

Figures
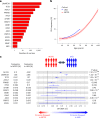
Fig. 1
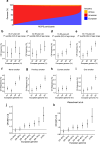
Fig. 1. Frequency of CH in the MCPS and UKB.
a, Number of individuals for each CH driver gene identified in MCPS. Driver CH genes are ranked from highest to lowest number of individuals. b, Frequency of overall CH by age. The center line represents the fitted values from the general additive model with P-spline smooth class; shaded regions, lower and upper bounds of the 95% CIs of the fitted values. MCPS participants aged 100 years or older were included as a single age group. c, Inter-population comparison of the frequency of overall CH and gene-specific CH in UKB compared to MCPS. Only CH driver genes identified in at least ten individuals are shown. Odds ratios and unadjusted two-sided P values were derived from a logistic regression model with all CH or gene-specific CH as the outcome and study cohort as the predictor, adjusted for age, sex and smoking status. In total, 414,030 UKB and 136,359 MCPS participants for whom smoking status was available were included for analysis. Measures of center represent the odds ratios; error bars, lower and upper bound of the 95% CI of the odds ratios. Solid circles represent significant associations (P < 0.05); hollow circles represent non-significant associations (P ≥ 0.05).
Fig. 2
Fig. 2. Ancestry association with CH frequency in the MCPS.
a, Frequency of all CH by age among individuals with >50% Indigenous American ancestry and individuals with >50% European ancestry. Ancestry genome proportion was inferred with RFMix2.0 software. The center line represents the fitted values from the general additive model with P-spline smooth class and the shaded region represents the lower and upper bound of the 95% CI of the fitted values. Individuals aged 70 years or above were included as a single age group. b, Frequency of all CH by binned proportion of European genome. Measures of center represent the observed CH frequencies; error bars, lower and upper bound of the 95% CI of CH frequencies. In total, 134,297 individuals with RFMix-inferred ancestry available were included for analysis. c, Frequency of smoking (previous, current or ever) by binned proportion of European genome. d, Intra-population comparison of the frequency of all CH and gene-specific CH among individuals with varying degrees of European and non-European (Indigenous American and African) genome. Only CH driver genes identified in at least ten individuals are shown here. Beta coefficients and unadjusted two-sided P values were derived from a logistic regression model with all CH or gene-specific CH as the outcome and with the proportion of European genome as the predictor, adjusted for age, sex and smoking status. In total, 134,255 individuals with RFMix-inferred ancestry and smoking status available were included for analysis. Measures of center represent the beta coefficients; error bars, lower and upper bound of the 95% CI of the beta coefficients. Full circles represent significant associations (P < 0.05); hollow circles represent non-significant associations (P ≥ 0.05).
Fig. 3
Fig. 3. Telomere length association with ancestry and CH in the MCPS.
a, Manhattan plot representing the common germline variants with MAF ≥ 1% included for LTL GWAS in 9,598 MCPS participants with WGS data available. Unadjusted two-sided P values on the y axis were derived from linear regression implemented using REGENIE software. The most significant variant (smallest P value) is annotated for each suggestive locus (P < 5 × 10−6). b, Distribution of LTL PRSs across individuals with varying degrees of European genome. PRSs were built using LTL GWAS summary statistics from 9,598 participants for whom WGS data were available and subsequently computed for the remaining 126,803 participants. Boxplots represent the median, first and third quartiles; whiskers represent 1.5 times the interquartile range. c, Association between CH or gene-specific CH (outcome) with LTL PRS (predictor) adjusted for age, sex and smoking status. In total, 124,659 individuals who were not included in the LTL GWAS in a and with proportion of European genome and smoking status data available were included for analysis here. Only CH genes identified in at least ten individuals are shown. Beta coefficients and P values were derived from a logistic regression model. Measures of center represent the beta coefficients; error bars, lower and upper bound of the 95% CI of the beta coefficients. Full circles represent significant associations (P < 0.05); hollow circles represent non-significant associations (P ≥ 0.05).
Fig. 4
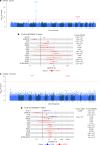
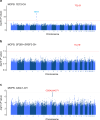
Fig. 4. GWAS and ExWAS of all CH and gene-specific CH in the MCPS.
a, Manhattan plot representing the common germline variants with MAF ≥ 1% included for CH GWAS. Unadjusted two-sided P values on the y axis were derived from Firth logistic regression implemented using REGENIE software. One new association at the TCL1A-TCL1B locus from MCPS (red) was identified as genome-wide significant (P < 5 × 10−8), with the nearest gene of the leading genetic polymorphism annotated. One previously reported association from the European population at the TERT locus is indicated in blue. b, rs187319135 identified as genome-wide significant from overall CH, and TET2-CH and SF3B1+SRSF2-CH. Overall and gene-specific CH risk estimates conferred by the minor allele (T) are shown here for 136,401 MCPS participants. ORs and unadjusted two-sided P values were derived from Firth logistic regression implemented using REGENIE software. Risk estimates are shown when both CH or gene-specific CH cases and controls have minor allele count (MAC) ≥ 1. Risk estimates for UKB were not included owing to the absence of risk allele (MAC = 0) in CH individuals. Measures of center represent the ORs; error bars, lower and upper bounds of the 95% confidence intervals of the ORs. Full circles represent significant associations (P < 0.05); hollow circles represent non-significant associations (P ≥ 0.05). c, Manhattan plot representing the rare (MAF < 1%) and common germline variants included for TET2-CH ExWAS. P values on the y axis were derived from Firth logistic regression implemented using REGENIE software. Rare TCL1B promoter variant rs774615666 (red) was identified as exome-wide significant (P < 1 × 10−8). Common TERT variant indicated in blue. d, rs774615666 identified as exome-wide significant from TET2-CH and SF3B1+SRSF2-CH. Overall and gene-specific CH risk estimates conferred by the minor allele (T) are shown here for 136,149 MCPS and 416,118 UKB participants. Risk estimates are shown when both CH or gene-specific CH cases and controls have MAC ≥ 1. ORs and unadjusted two-sided P values were derived from Firth logistic regression implemented using REGENIE software for MCPS and Fisher’s exact test for UKB. Measures of center represent the ORs; error bars, lower and upper bound of the 95% confidence interval of the ORs. Full circles represent significant associations (P < 0.05); hollow circles represent non-significant associations (P ≥ 0.05).
Fig. 5
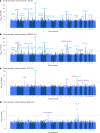
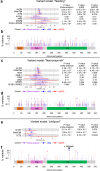
Fig. 5. Cross-ancestry GWAS meta-analysis of all CH and gene-specific CH in the MCPS and UKB.
ad, Manhattan plots representing the common germline variants with MAF ≥ 1% included for GWAS in MCPS and UKB Europeans for all CH (a), and DNMT3A-CH (b), TET2-CH (c) and ASXL1-CH (d). Unadjusted two-sided P values on the y axis were derived from the P value-based method implemented using METAL software. Five novel loci from the meta-analysis of MCPS and UKB (purple) were identified as genome-wide significant (P < 5 × 10−8), with the nearest gene of the leading genetic polymorphism annotated for the respective locus. Previously reported associations from European populations are indicated in light blue and novel associations identified in the European population in our study are indicated in dark blue.
Extended Data Fig. 1
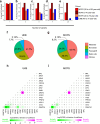
Extended Data Fig. 1. Frequency and characteristics of clonal haematopoiesis (CH).
ae, Percentage of CH individuals with 1 (a), 2 (b), 3 (c), 4 (d), or 5 or more (e) CH driver gene variants stratified by different age groups. f, g, CH driver gene variants stratified by consequence on protein-coding sequence in UK Biobank (UKB; f) and Mexico City Prospective Study (MCPS; g). h, i, Assessment of co-occurrence or mutual exclusivity of CH driver genes among participants with at least two mutated CH driver genes in UKB (h) and MCPS (i). ORs and two-sided P values were derived from logistic regression model. P values were adjusted for multiple testing using Benjamini-Hochberg procedure. CH, clonal haematopoiesis; FDR, false discovery rate; MCPS, Mexico City Prospective Study; UKB, UK Biobank.
Extended Data Fig. 2
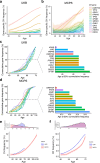
Extended Data Fig. 2. Frequency of clonal haematopoiesis (CH) by age.
Frequency of CH individuals by age stratified by gene-specific CH in UK Biobank (UKB; a) and Mexico City Prospective Study (MCPS; b). The centre line represents the fitted values from the general additive model with P-spline smooth class, and the shaded region represents the lower and upper bound of the 95% confidence interval of the fitted values. Y-axis is in log2 scale. Only CH driver genes identified in at least 10 individuals are shown here (a, b). c, d, Cumulative frequency of CH individuals by age stratified by gene-specific CH in UKB (c) and MCPS (d). Only CH driver genes identified in at least 10 individuals are shown here. e, Same as Fig. 1b, but with UKB and MCPS age distribution indicated. f, Frequency of CH individuals by age after age- and sex-matching UKB and MCPS participants. Overall CH frequency was 4.55% and 2.87% for UKB and MCPS participants, respectively (P < 2.2 × 10⁻¹⁶). The centre line represents the fitted values from the general additive model with P-spline smooth class, and the shaded region represents the lower and upper bound of the 95% confidence interval of the fitted values (e, f). CH, clonal haematopoiesis; MCPS, Mexico City Prospective Study; UKB, UK Biobank.
Extended Data Fig. 3
Extended Data Fig. 3. Inter-population analysis of overall clonal haematopoiesis (CH) and gene-specific CH between UK Biobank (UKB) and Mexico City Prospective Study (MCPS).
a, Comparison of CH frequency between 416,118 UKB and 136,401 MCPS participants. Logistic regression model was adjusted for age, sex, and smoking status, and the percentage of bases with ≥20x coverage for the corresponding CH gene. For overall CH, the average coverage across the 15-gene panel was included as the co-variate. b, Comparison of CH frequency between 416,109 UKB and 95,294 MCPS participants aged 40–70 years of age. Logistic regression model was adjusted for age, sex, and smoking status. c, Comparison of CH frequency between 191,476 UKB males and 31,074 MCPS males aged 40–70 years of age. Logistic regression model was adjusted for age and smoking status. d, Comparison of CH frequency between 224,633 UKB females and 64,220 MCPS females aged 40–70 years of age. Logistic regression model was adjusted for age and smoking status. e, Comparison of CH frequency between 223,303 UKB and 66,517 MCPS never smokers. f, Comparison of CH frequency between 147,650 UKB and 32,579 MCPS previous smokers. g, Comparison of CH frequency between 43,077 UKB and 37,263 MCPS current smokers. h, Comparison of CH frequency between 190,727 UKB and 69,842 MCPS ever smokers. Logistic regression model was adjusted for age and sex (eh). Only gene-specific CH genes identified in at least 10 individuals are shown here. Odds ratios and unadjusted two-sided P values were derived from logistic regression model with all CH or gene-specific CH as outcome and study cohort as the predictor. Measures of centre represent the odds ratios, and the error bars represent the lower and upper bound of the 95% confidence interval of the odds ratios. Full circles represent significant associations (P < 0.05) while hollow circles represent non-significant associations (P ≥ 0.05). 95% CI, 95% confidence interval; CH, clonal haematopoiesis; MCPS, Mexico City Prospective Study; OR, odds ratio; UKB, UK Biobank.
Extended Data Fig. 4
Extended Data Fig. 4. Frequency of all clonal haematopoiesis (CH) across different strata of European genome proportions in Mexico City Prospective Study (MCPS).
a, On the y-axis is the proportion of European, Indigenous American, and African genome across the MCPS participants on the x-axis. be, Frequency of overall CH across groups of individuals with increasing proportion of European genome, stratified by age quartiles. The proportions of European genome were binned by quartiles in this analysis whereby quartile 1 (Q1), Q2, Q3, and Q4 represent [0–18.2), [18.2–30.8), [30.8–42.5), and [42.5–90.3] proportion of European genome, respectively. In total, 134,297 individuals with proportion of European genome available were included for analysis here. fi, Frequency of overall CH across groups of individuals with increasing proportion of European genome, stratified by smoking status (never, previous, current, and ever). In total, 134,255 individuals with proportion of European genome and smoking status available were included for analysis here. Error bars represent the lower and upper bound of 95% confidence interval of the CH frequencies (bi). j, k, Overall CH risk associated with binned proportion of European genome relative to individuals with <10% European genome when CH individuals were defined using the 15-gene panel in our study (j) or defined using the 58-gene panel (Vlasschaert et al.; k). Odds ratios and unadjusted two-sided P values were derived from logistic regression model with all CH as outcome, and with binned proportion of European genome as predictor, adjusted for age, sex, and smoking status. In total, 134,255 individuals with proportion of European genome and smoking status available were included for analysis here. Measures of centre represent the odds ratios, and the error bars represent the lower and upper bound of the 95% confidence interval of the odds ratios. Full circles represent significant associations (P < 0.05) while hollow circles represent non-significant associations (P ≥ 0.05) (j, k). 95% CI, 95% confidence interval; CH, clonal haematopoiesis; MCPS, Mexico City Prospective Study; OR, odds ratio; Q, quartile.
Extended Data Fig. 5
Extended Data Fig. 5. Establishing, applying, and validating telomere length polygenic risk score (PRS) derived from Mexico City Prospective Study (MCPS) participants with whole-genome sequencing (WGS) data available.
a, In total, WGS-inferred leukocyte telomere length (LTL) measurements were available for 9,602 individuals, of which, 9,598 individuals had LTL measurements within ±3 standard deviations and subsequently included for LTL GWAS. b, Distribution of WGS-inferred LTL by increasing age group among 9,598 individuals. c, d, Distribution of LTL PRS across 126,803 individuals with varying degree of European genome for PRS built using published independent variants from Trans-Omics for Precision Medicine (TOPMed) multi-ancestry cohort (c) and from UKB European-majority cohort (d). The 9,598 individuals with WGS-inferred LTL which were included for LTL GWAS were excluded from analysis in (c, d). Boxplots represent the median, first and third quartiles, and whiskers represent 1.5 times the interquartile range (bd). e, Validation of MCPS-derived LTL PRS among the different ancestry groups in UKB based on correlation between LTL PRS versus WGS-inferred LTL. A linear regression model was fitted using WGS-inferred LTL as the outcome and LTL PRS as the predictor, adjusted for adjusted for age, sex, smoking status, and the first four genetic principal components. The effect size of the model for each ancestry group subsequently reported here. Measures of centre represent the beta coefficients, and the error bars represent the lower and upper bound of the 95% confidence interval of the beta coefficients. f, Validation of MCPS-derived LTL PRS by assessing improvement in R-squared value computed by comparing linear regression model with versus without LTL PRS as co-variate. Specifically, the former model is the same as (e). In the latter model, LTL PRS was excluded as a co-variate. The percentage increase in R-squared value was computed for the former model relative to the latter model and subsequently reported here (f). In total, 624 AMR, 2,220 EAS, 7,451 AFR, 8,005 SAS, and 410,654 EUR participants with LTL PRS, WGS-inferred LTL and smoking status available were included for analysis here (e, f). 95% CI, 95% confidence interval; AFR, African; AMR, Admixed American; EAS, East Asian; EUR, European; LTL, leukocyte telomere length; MCPS, Mexico City Prospective Study; PRS, polygenic risk score; SAS, South Asian; TOPMed, Trans-Omics for Precision Medicine; UKB, UK Biobank; WGS, whole-genome sequencing.
Extended Data Fig. 6
Extended Data Fig. 6. Genome-wide association study (GWAS) gene-specific clonal haematopoiesis (CH) in Mexico City Prospective Study (MCPS).
ac, Manhattan plots representing the common germline variants with minor allele frequency (MAF) ≥ 1% included for GWAS in MCPS for TET2- (a), splicing factor- (b), and ASXL1- (c) CH. Unadjusted two-sided P values on y-axis were derived from Firth logistic regression implemented by REGENIE software. Three novel signals (red) were identified as genome-wide significant (P value < 5 × 10⁻⁸, red horizontal line) with the nearest gene of the leading SNP annotated for the respective locus. Previously reported associations from European populations indicated in blue. CH, clonal haematopoiesis; GWAS, genome-wide association study; MAF, minor allele frequency; MCPS, Mexico City Prospective Study.
Extended Data Fig. 7
Extended Data Fig. 7. Risk estimates of a novel common clonal haematopoiesis (CH) risk variant identified from ASXL1-CH genome-wide association study (GWAS) in Mexico City Prospective Study (MCPS).
rs2958593 identified as genome-wide significant. Overall CH and gene-specific CH risk estimates conferred by the minor allele (T) shown here for 406,826 UK Biobank (UKB) and 136,401 MCPS participants. Odds ratios and unadjusted two-sided P-values were derived from Firth logistic regression implemented by REGENIE software. Measures of centre represent the odds ratio, and the error bars represent the lower and upper bound of the 95% confidence interval of the odds ratios. Full circles represent significant associations (P < 0.05) while hollow circles represent non-significant associations (P ≥ 0.05). CH, clonal haematopoiesis; GWAS, genome-wide association study; MCPS, Mexico City Prospective Study; OR, odds ratio; UKB, UK Biobank.
Extended Data Fig. 8
Extended Data Fig. 8. Exome-wide association study (ExWAS) of SF3B1+SRSF2-CH in Mexico City Prospective Studt (MCPS).
Manhattan plot representing the common (minor allele frequency (MAF) ≥ 1%) and rare (MAF < 1%) germline variants included for ExWAS. Unadjusted two-sided P-values on y-axis were derived from Firth logistic regression implemented by REGENIE software. One novel association from ExWAS indicated in red. Nearest gene of the leading SNP annotated. CH, clonal haematopoiesis; ExWAS, exome-wide association study; MAF, minor allele frequency; MCPS, Mexico City Prospective Study.
Extended Data Fig. 9
Extended Data Fig. 9. Conditional analysis of rs187319135 (TCL1B upstream) and rs774615666 (TCL1B promoter) variants in Mexico City Prospective Study (MCPS).
a, b, Risk conferred by rs187319135 (T allele) to overall clonal haematopoiesis (CH) and gene-specific CH before versus after conditioning on rs774615666. In the latter mode, genotype of rs774615666 was determined from whole-exome sequencing (WES) and included as co-variate in the Firth logistic regression model implemented by REGENIE software, adjusted for age, sex, and first ten genetic principal components. In total, 136,149 participants with WES-called rs774615666 genotype and complete co-variate data available were included for analysis here. c, d, Risk conferred by rs774615666 (T allele) to overall CH and gene-specific CH before versus after conditioning on rs187319135. In the latter mode, genotype of rs187319135 was hard-called from the imputed genetic data, and included as co-variate in the Firth logistic regression model implemented by REGENIE, adjusted for age, sex, and first ten genetic principal components. Thresholds for hard-calling genotypes were 0 ≤ x ≤ 0.1, 0.9 ≤ x ≤ 1.1, and 1.9 ≤ x ≤ 2.0 for homozygous minor allele, heterozygous minor/major allele, and homozygous major allele, respectively, where x is the allelic dosage (expected number of copies of major allele). Allelic dosages outside the range of thresholds were coded as missing. In total, 134,651 participants with SNP array-based hard-called rs187319135 genotype, WES-called rs774615666 genotype, and complete co-variate data available were included for analysis here. (a, c) Odds ratio and unadjusted two-sided P values were derived from Firth logistic regression implemented by REGENIE software. Measures of centre represent the odds ratios, and the error bars represent the lower and upper bound of the 95% confidence interval of the odds ratios. Full circles represent significant associations (P < 0.05) while hollow circles represent non-significant associations (P ≥ 0.05). P value for rs187319135 *** < 5 × 10⁻⁸ (genome-wide significant), ** < 5 × 10⁻⁶ (suggestive), * < 0.05 (nominal). P value for rs774615666 *** < 1 × 10⁻⁸ (exome-wide significant), ** < 1 × 10⁻⁶ (suggestive), * < 0.05 (nominal). 95% CI, 95% confidence interval; CH, clonal haematopoiesis; MAF, minor allele frequency; MCPS, Mexico City Prospective Study; OR, odds ratio; UKB, UK Biobank.
Extended Data Fig. 10
Extended Data Fig. 10. Rare CHEK2 variant burden association meta-analysis across Mexico City Prospective Study (MCPS) and UK Biobank (UKB).
a, b, CHEK2 “flexdmg” qualifying variant model identified as genome-wide significant (P value < 1 × 10⁻⁸) in overall clonal haematopoisis (CH) and DNMT3A-CH. c, d, CHEK2 “flexnonsynmtr” qualifying variant model identified as genome-wide significant in overall CH. e, f, CHEK2 “ptv5pcnt” qualifying variant model identified as genome-wide significant in overall CH and DNMT3A-CH. For each qualifying variant model, the risk estimates conferred (a, c, e) and individual variant as a percentage all CHEK2 variants identified in MCPS and UKB (b, d, f) shown. Odds ratio and unadjusted two-sided P values were derived from Cochran-Mantel-Haenszel (CMH) test. Measures of centre represent the odds ratios, and the error bars represent the lower and upper bound of the 95% confidence interval of the odds ratios. Full circles represent significant associations (P < 0.05) while hollow circles represent non-significant associations (P ≥ 0.05) (a, c,e). In total, 136,398 MCPS and 416,115 UKB participants were included for analysis here. 95% CI, 95% confidence interval; CH, clonal haematopoiesis; FHA, forkhead-associated domain; KD, kinase domain; MCPS, Mexico City Prospective Study; OR, odds ratio; SCD, SQ/TQ cluster domain (SCD); UKB, UK Biobank.

References

    1. Gurdasani, D., Barroso, I., Zeggini, E. & Sandhu, M. S. Genomics of disease risk in globally diverse populations. Nat. Rev. Genet.20, 520–535 (2019). - PubMed
    1. Peterson, R. E. et al. Genome-wide association studies in ancestrally diverse populations: opportunities, methods, pitfalls, and recommendations. Cell179, 589–603 (2019). - PMC - PubMed
    1. Genovese, G. et al. Clonal hematopoiesis and blood-cancer risk inferred from blood DNA sequence. N. Engl. J. Med.371, 2477–2487 (2014). - PMC - PubMed
    1. Jaiswal, S. et al. Age-related clonal hematopoiesis associated with adverse outcomes. N. Engl. J. Med.371, 2488–2498 (2014). - PMC - PubMed
    1. McKerrell, T. et al. Leukemia-associated somatic mutations drive distinct patterns of age-related clonal hemopoiesis. Cell Rep.10, 1239–1245 (2015). - PMC - PubMed

Publication types

Substances

LinkOut - more resources