. 2025 Feb 14;32(1):21.
doi: 10.1186/s12929-024-01113-7.

miR-200c inhibition and catalase accelerate diabetic wound healing

Affiliations

miR-200c inhibition and catalase accelerate diabetic wound healing

Marco D'Agostino et al. J Biomed Sci. .

Abstract

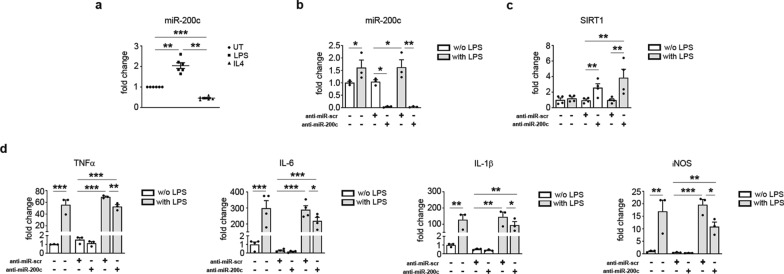
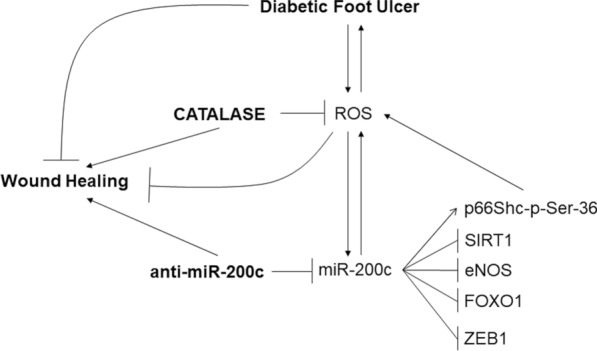
Background: Reactive oxygen species (ROS) are increased in diabetic conditions and play a causal role in diabetic foot ulcers (DFU). We previously showed that ROS up-regulate miR-200c expression, that in turns causes apoptosis, senescence, ROS upregulation and nitric oxide decrease, leading to endothelial disfunction.

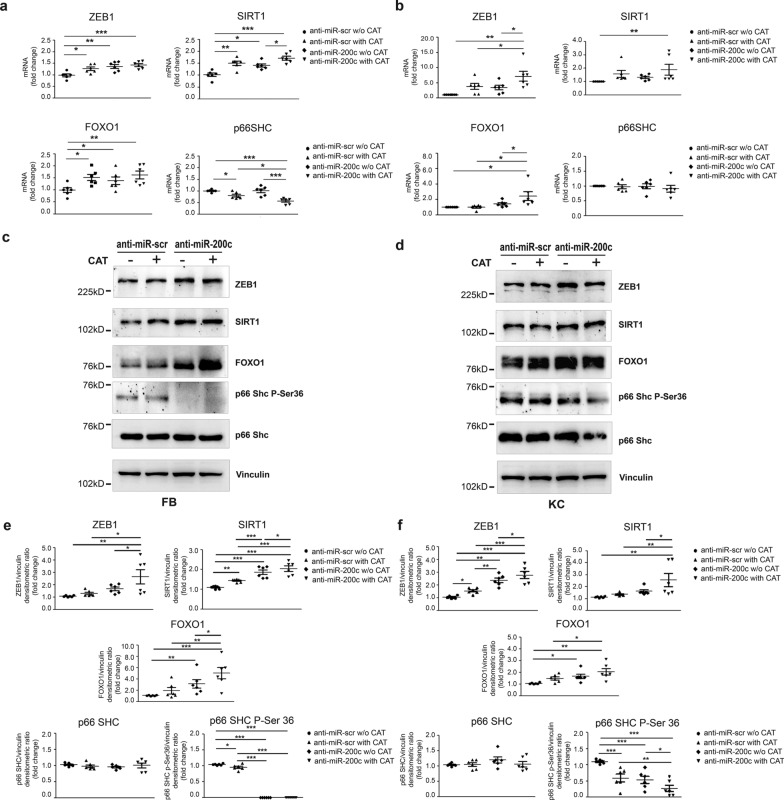
Methods: The aim of this study is to dissect miR-200c role in DFU and to explore the potential role of anti-miR-200c and antioxidant catalase (CAT) in promoting wound healing (WH). miR-200c inhibition and CAT treatment were performed either in immortalized keratinocytes (HaCaT) or in primary fibroblasts (FBs) and keratinocytes (KCs) deriving from diabetic patients (pts) undergoing amputations. Primary cells deriving from pts undergoing saphenectomies were used as controls. The miR-200c blockade was performed either via lentiviral particles bearing an anti-miR-200c sequence or locked nucleic acid (LNA) anti-miR-200c oligos. Equine CAT was administered on cell medium. The WH assay was performed in vivo on diabetic (db/db) mice by a topical treatment with CAT and LNA anti-miR-200c on wounds dissolved in a Pluronic gel mixture, administered every three days.

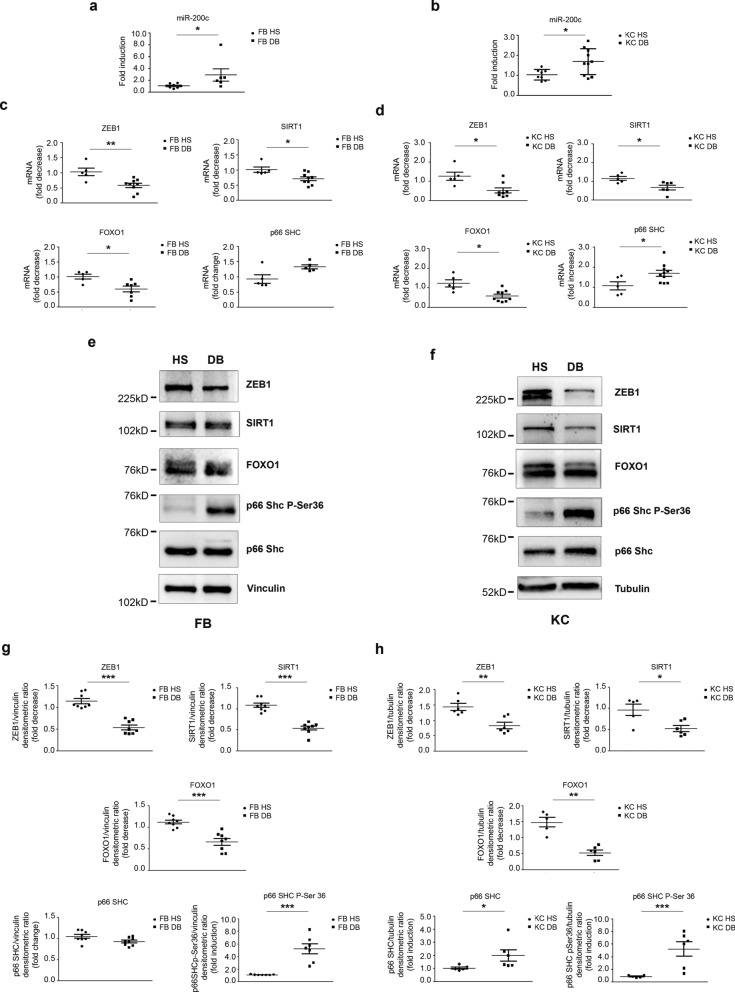
Results: We found that miR-200c levels were increased by different stimuli known to induce ROS, such as ultraviolet radiation (UV), hydrogen peroxide (H2O2), and high glucose in HaCaT. miR-200c was also upregulated in skin biopsies, in FBs and KCs isolated from pts with DFU vs controls. Forced miR-200c expression induced ROS in both FBs and KCs, and CAT reduced it. miR-200c inhibition improved WH in HaCaT, both under basal conditions and after UV and H2O2 treatment, and the simultaneous treatment with CAT accelerated it. miR-200c inhibition accelerated WH in KCs of DFU pts, increasing its protein targets: sirtuin 1 (SIRT1), the transcription factors FOXO1 and ZEB1 and decreasing p66Shc phosphorylation at Ser-36, that is induced by ROS, and the co-treatment with CAT showed synergistic effects in reducing ROS and cytotoxicity. Interestingly, CAT treatment decreased miR-200c expression in FBs and KCs of DFU pts. Topical administration of anti-miR-200c and CAT in a WH model of diabetic mice accelerated closure.

Conclusions: Anti-miR-200c and CAT could be considered a novel treatment for DFU and, possibly, for other types of non-diabetic skin ulcers.

Keywords: Apoptosis; Catalase; Diabetic foot ulcers; MicroRNAs; Reactive oxygen species; Skin.


Conflict of interest statement

Declarations. Ethics approval and consent to participate: The human skin biopsies collection was approved by the Ethics Committee of IDI-IRCCS (Prot. N.29/CE/2018 approved on 09/05/2018). Diabetic biopsies were taken from pts with foot ulcers undergoing major amputation from non-lesional area of limb, control skin biopsies were taken from subjects undergoing saphenectomies. All pts provided written informed consent at enrolment. The study was conducted following the Good Clinical Practice guidelines and according to the declaration of Helsinki. Animal experimentation was approved by the animal welfare organism of IDI-IRCCS and authorized by the Animal Committee of Italian Ministry of Health (protocol n. BBA76.2 approval n. 835/2018-PR expired in March 2023). The BMDM extraction was approved by the animal welfare organism of CNR and authorized by the Animal Committee of Italian Ministry of Health (protocol n.6D050.7 approval n.375/2019 PR expired June 2023). Consent for publication: Not applicable. Competing interests: AM declares that the study has been partially funded by Idi Farmaceutici s.r.l. (2018–2019) which commercializes a topical medicine based on equine catalase. DA is employed by Idi Farmaceutici s.r.l., the remaining authors declare that the research was conducted in the absence of any commercial or financial relationships that could be construed as a potential competing interests.

Figures

Fig. 1
Fig. 1
miR-200c is upregulated by oxidative stress in HaCaT and skin biopsies of pts with DFU. a HaCaT cells were exposed to 400 μM H2O2 for 16 h. Then total RNA was extracted and assayed for miR-200c expression levels by RT-qPCR. (N = 4; *p < 0.05). b HaCaT were treated or not (w/o UV) with 50 J/m2 of UV light. After 16 h in serum-free media, total RNA was extracted and assayed for miR-200c expression levels by RT-qPCR (N = 5; * p < 0.05). c HaCaT cells were grown in low glucose DMEM (containing 5 mM glucose) supplemented with 25 mM high glucose medium for 3 days, 25 mM mannitol was used as isosmotic control. Then miR-200c expression was evaluated (N = 5; *p < 0.05). d Skin Biopsies derived from pts with DFU (DB) undergoing major amputations and from normoglycemic HS pts undergoing saphenectomies, used as controls, were assayed for oxidative stress by DHE fluorescence. Representative images showed that skin tissues of DFU pts display higher oxidative stress. e Scatter plot representing the percentage of DHE fluorescence positivity (N = 5 HS, N = 6 DB; *p < 0.05). f Total RNA extracted from biopsies of DB pts and HS controls was assayed for miR-200c levels (N = 5 HS; N = 8 DB; *p < 0.05). g Scatter plot representing ISH quantification of five different areas per tissue sample, subtracted of miR-scramble signal and normalized vs U6 ISH fluorescence positivity. Data are presented as fold induction vs ctrl pts (N = 4; *p < 0.05). h Representative in situ staining of miR-200c (Red) (left panels) in skin tissues of DB undergoing major amputations and from HS normoglycemic pts controls. In situ staining of U6 snRNA (Red) was used as normalization control (central panels). miR-scramble (Red) was used as negative control (right panels). Skin tissues were counterstained with DAPI (blue). miR-200c in situ staining was higher in DB skin compared to HS one
Fig. 2
Fig. 2
miR-200c is upregulated in macrophages upon M1 polarization and its inhibition decreases M1 genes. a BMDM were polarized towards M1 and M2 phenotype by LPS (10 ng/ml) and IL-4 (20 ng/ml), respectively, and compared to untreated (UT) macrophages. Total RNA was extracted and miR-200c levels were measured by RT-qPCR. MiR-200c was increased in M1 and decreased in M2 macrophages (N = 6; **p < 0.01; ***p < 0.001). b, c, d BMDM were treated with LNA anti miR-scramble (scr) or anti-miR-200c (1 μM) for 24 h, stimulated with LPS (10 ng/ml) for 2 h and compared to unstimulated macrophages. Then total RNA was extracted. b miR-200c levels were measured by RT-qPCR in total RNA extracted from BMDM. miR-200c was strongly decreased by LNA anti-miR-200c treatment both under basal and LPS treatment (N = 3; *p < 0.05; **p < 0.01). c RT-qPCR of a miR-200c target gene, SIRT1, that was increased in BMDM anti-miR-200c treated cells, both under basal and LPS treatment (N = 4; *p < 0.05; **p < 0.01). d RT-qPCR of M1-inflammatory genes: TNFα L-6, IL-1β, iNOS. All M1 genes were induced by LPS treatment and were decreased by anti-miR-200c in LPS treated BMDM (N = 3–4; *p < 0.05; **p < 0.01; ***p < 0,001)
Fig. 3
Fig. 3
miR-200c targets are downregulated and p66 Shc Ser-36 phosphorylation is increased in human skin biopsies of DFU pts. a Total RNA extracted from biopsies of DB and normoglycemic controls (HS). ZEB1, SIRT1, FOXO1 and p66Shc mRNA were quantified by RT-qPCR (N = 5–6 HS, N = 6–8 DB *p < 0.05; **p < 0.01). b Representative immunohistochemistry (IHC) of ZEB1, SIRT1, FOXO1, P66Shc-P-Ser36 and P66Shc. IHC levels were evaluated in paraffin-embedded biopsies of skin isolated by patient with DFU compared to HS. c Scatter plots representing the IHC quantification of ZEB1, SIRT1, FOXO1, P66Shc-P-Ser36 and P66Shc of DFU compared to HS. IHC was quantified by Image J colour deconvolution of three adjacent fields for each section. Graphs showed IHC positivity area, expressed in percentage of positivity (N = 5 HS, N = 5–6 DB; *p < 0.05)
Fig. 4
Fig. 4
miR-200c is upregulated in DFU FBs and KCs and its targets are downregulated while p66Shc Ser-36 phosphorylation is decreased. Total RNA was extracted from FBs and KCs isolated from biopsies of DFU or biopsies of normoglycemic pts (HS). a miR-200c expression levels were induced in FBs isolated by biopsies of pts with DFU (FB DB) compared to HS (N = 7 FB HS, N = 8 FB DB; *P < 0.05). b miR-200c expression levels were induced in KCs isolated by biopsies of pts with DFU (KC DB) compared to HS (N = 8 KC HS, N = 10 KC DB; *P < 0.05). c ZEB1, SIRT1 and FOXO1 mRNA expression levels were downmodulated in FBs extracted by skin biopsies of pts with DFU vs healthy control subjects, while P66Shc mRNA was induced, albeit not significantly (N = 5 FB HS, N = 7–9 FB DB *p < 0.05; **p < 0.01). e ZEB1, SIRT1 and FOXO1mRNA expression levels were decreased in KCs isolated by skin biopsies of pts with DFU vs healthy control subjects, while P66Shc mRNA was induced (N = 5 KC HS, N = 7–8 KC DB *p < 0.05). e–f Representative western blots of ZEB1, SIRT1, FOXO1, P66Shc-P-Ser36 and P66Shc of DFU compared to HS ones of FBs and KCs, respectively. g–h Expression levels of ZEB1, SIRT1, FOXO1, P66Shc-P-Ser36 and P66Shc proteins were evaluated by densitometric analysis and normalized by either vinculin or α-tubulin protein levels, as indicated (N = 8 FB HS, N = 8 FB DB; N = 5–6 KC HS, N = 6 KC DB; *p < 0.05; **p < 0.01; ***p < 0.001). Source data are available for this figure: Additional file1: Fig.S6
Fig. 5
Fig. 5
CAT treatment decreased miR-200c-induced oxidative stress. Primary human skin FBs from HS were infected either with a lentivirus encoding miR-200c or with a control virus. Then cells were treated with 400 UI/ml equine CAT for 16 h. a Representative DHE fluorescence of FBs overexpressing miR-200c with or without CAT. Nuclei were stained with DAPI. Scale bar: 10 μm. b Scatter plot representing DHE fluorescence positivity per nuclei and expressed as fold change vs ctrl (N = 6; *p < 0.05; **p < 0.01). c Primary human skin KCs were infected either with a lentivirus encoding miR-200c or with a control virus. Then cells were treated with 400 UI/ml equine CAT for 16 h. Representative DHE fluorescence of KCs overexpressing miR-200c with or without CAT. Nuclei were stained with DAPI. Scale bar: 10 μm. d Scatter plot representing DHE fluorescence positivity per nuclei and expressed as fold change vs ctrl (N = 6; **p < 0.01; ***p < 0.001)
Fig. 6
Fig. 6
miR-200c inhibition and CAT treatment downmodulated oxidative stress in FBs and KCs of DFU pts. a, b FBs and KCs of DFU pts were treated with 400 UI/ml for 16 h, then cells were harvested and miR-200c expression levels were quantified by RT-qPCR (N = 6 FB DB, N = 6 KC DB; *p < 0.05). c, d FBs and KCs of DFU pts were infected either with a lentivirus encoding anti-miR-200c or with a control virus (anti-miR-scr). Then cells were incubated with 400 UI/ml equine CAT for additional 16 h. Representative image of FBs and KCs diabetic pts showed that CAT treatment and anti-miR-200c individually decreased DHE signal compared to anti-miR-scr untreated cells, the co-treatment reduced oxidative stress especially in KC of DFU. e, f Oxidative stress was assayed by DHE fluorescence which was normalized for the number of DAPI-positive nuclei and expressed as fold decrease vs anti-miR-scr untreated cells. Scale bar: 10 μm (N = 6 FB DB; N = 6 KC DB; *p < 0.05; **p < 0.01; ***p < 0.001)
Fig. 7
Fig. 7
miR-200c targets are upregulated and p66shc Ser-36 phosphorylation is decreased by anti-miR-200c and CAT treatment in DFU FBs and KCs. FBs and KCs of DFU pts were infected either with a lentivirus encoding anti-miR-200c or with a control virus. Afterwards cells were incubated with 400 UI/ml CAT for additional 16 h. a, b ZEB1, SIRT1, FOXO1 and P66Shc mRNA were quantified by RT-qPCR in FBs and KCs respectively (N = 6; *p < 0.05; **p < 0.01; ***p < 0.001). c, d Representative western blots of ZEB1, SIRT1, FOXO1, P66Shc-P-Ser36 and P66Shc in FBs and KCs of DFU pts, respectively. e, f Scatter plots showing the expression levels of ZEB1, SIRT1, FOXO1, P66Shc-P-Ser36 and P66Shc proteins were evaluated by densitometric analysis normalized to vinculin protein levels in FBs and KCs (N = 6; *p < 0.05; **p < 0.01; ***p < 0.001). Source data are available for this figure: Additional file1: Fig.S6
Fig. 8
Fig. 8
Anti-miR-200c and CAT treatment decrease DFU FBs and KCs cytotoxicity and their action is synergic. a, b FBs and KCs of HS were infected either with a lentivirus encoding miR-200c or with a control virus. After 16 h cytotoxicity assay was performed. miR-200c overexpression increased cytotoxicity (N = 6; *P < 0.05). c, d FBs and KCs of DFU pts were infected either with a lentivirus encoding anti-miR-200c or with a control virus (anti-miR-scr). Afterwards, cells were incubated with 400 UI/ml CAT for additional 16 h. Cytotoxicity assay was performed (N = 6; *p < 0.05; **p < 0.01; ***p < 0.001)
Fig. 9
Fig. 9
Anti-miR-200c and CAT accelerate WH upon ROS and in DFU KCs and co-treatment is synergic. a HaCaT cells were infected with either anti-miR-200c or with a control virus (anti-miR-scr) and a scratch assay was performed. Graph showing the % of cell free area vs time zero of anti-miR-200c treated cells compared with miR-scramble control at the time points indicated in figure (N = 6; *p < 0.05, **p < 0.01). b HaCaT cells were treated with 400 UI/ml CAT for the indicated times during the scratch assay. Graph showing the % of cell free area vs time zero of CAT treated cells compared to untreated control at the timepoints indicated in figure (N = 5; **p < 0.01). c HaCaT cells were infected with anti-miR-200c or with a control virus. A scratch assay was performed and then cells were treated or not for 16 h with 400 μM H2O2, afterwards cells were treated or not with CAT for 8 h. Representative image of scratch assay showing the migration process at 24 h. d HaCaT cells were infected with either anti-miR-200c or with a control virus, then cells were irradiated with 50 J/m2 of UV light. Afterwards, a scratch assay was performed, and the cells were treated or not with 400 UI/ml CAT. Representative images of the scratch assay monitoring cellular migration at 72 h. e Scatter plot showing the % of cell free area vs time zero at 24 h (N = 6; *p < 0.05; **p < 0.01; ***p < 0.001). f Scatter plot showing the % of cell free area vs time zero at 72 h (N = 6; *p < 0.05; **p < 0.01; ***p < 0.001). g KCs of DFU pts were infected either with a lentivirus encoding anti-miR-200c or with a control virus (anti-miR-scr). Afterwards, cells were incubated with 400 UI/ml equine CAT for additional 24 h. Representative image of a scratch assay that monitored the migration process at 24 h. h Scatter plot showing % of cell free area vs time zero (N = 6; *p < 0.05; ***p < 0.001)
Fig. 10
Fig. 10
miR-200c inhibition and CAT treatment accelerates WH in diabetic mice. Full-thickness excisional wounds of 6 mm were performed on diabetic mice (db/db). The wounds were treated with LNA anti-miR-200c or a control sequence (anti-miR-scr) dissolved in a mixture of 30% Pluronic F-127 gel containing either LNA-scramble or anti-miR-200c (0.04 nmole/μl) in presence or absence of CAT (8UI/μl), every three days until wound closure. a The representative panels showed the rate of WH from day 0 to day 21 in the four groups of mice. b Bar graph representing the relative wound area expressed in % of wound area vs Time 0 for the indicated times and treatments. Two-way Anova, values are expressed as mean ± SEM (N = 11 anti-miR-scr w/o CAT mice, N = 10 anti-miR-scr with CAT mice, N = 11 anti-miR-200c w/o CAT mice, N = 10 anti-miR-200c with CAT mice, *P < 0.05, **P < 0.01, ***P < 0.001; asterisks of statistical significance are vs scramble ctrl at each time point, or vs the groups indicated by the lines in the bar graphs). c, d Graph and table representing the % of mice of different groups that reach a wound area < 10% compared to time zero. 100% of anti-miR-200c + CAT group reached < 10% area at 12 days after wounding, 100% of anti-miR-200c at 18 days, and 100% of CAT group at 21 days. e Graphical representation of the decline in the % of WH described by the nonlinear mixed-effects model for the different treatments from the model summary in Table 1
Fig.11
Fig.11
Proposed mechanism of action of miR-200c inhibition and CAT treatment in DFU healing. DFU displays an increased level of oxidative stress caused both by hyperglycaemia and ischemia; ROS, further enhance miR-200c expression that, in turn, worsens oxidative stress and delays DFU healing. miR-200c downregulates its direct targets ZEB1, SIRT1, eNOS and FOXO1, and also induces the phosphorylation of p66Shc at Ser-36, which upregulates ROS. Anti-miR-200c and CAT decrease oxidative stress, inflammation, skin and vascular cell senescence and death and, by these mechanisms promote DFU healing. Thus, topical administration of a combination of anti-miR-200c and CAT holds promise as a novel therapeutic approach for chronic DFU

References

    1. Henning RJ. Type-2 diabetes mellitus and cardiovascular disease. Future Cardiol. 2018;14(6):491–509. - PubMed
    1. Armstrong DG, Cohen K, Courric S, Bharara M, Marston W. Diabetic foot ulcers and vascular insufficiency: our population has changed, but our methods have not. J Diabetes Sci Technol. 2011;5(6):1591–5. - PMC - PubMed
    1. Bartel DP. MicroRNAs: genomics, biogenesis, mechanism, and function. Cell. 2004;116(2):281–97. - PubMed
    1. Magenta A, Greco S, Gaetano C, Martelli F. Oxidative stress and microRNAs in vascular diseases. Int J Mol Sci. 2013;14(9):17319–46. - PMC - PubMed
    1. Carlomosti F, D’Agostino M, Beji S, Torcinaro A, Rizzi R, Zaccagnini G, et al. Oxidative stress-induced miR-200c disrupts the regulatory loop among SIRT1, FOXO1, and eNOS. Antioxidants Redox Signal. 2017. 10.1089/ars.2016.6643. - PubMed