. 2025 Feb 13;13(1):28.
doi: 10.1186/s40478-025-01942-z.

Disruption of mitochondrial homeostasis and permeability transition pore opening in OPA1 iPSC-derived retinal ganglion cells

Affiliations

Disruption of mitochondrial homeostasis and permeability transition pore opening in OPA1 iPSC-derived retinal ganglion cells

Michael Whitehead et al. Acta Neuropathol Commun. .

Abstract

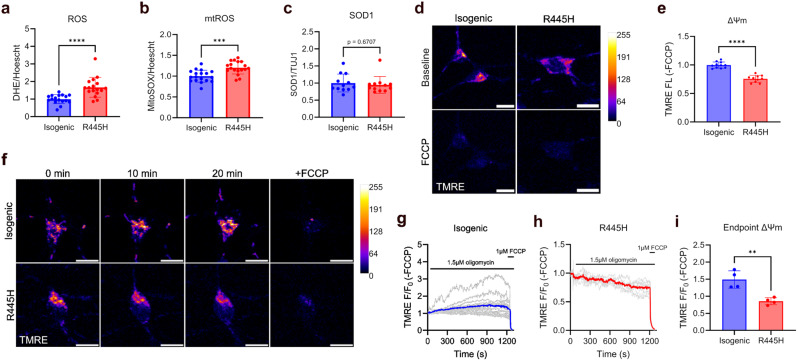
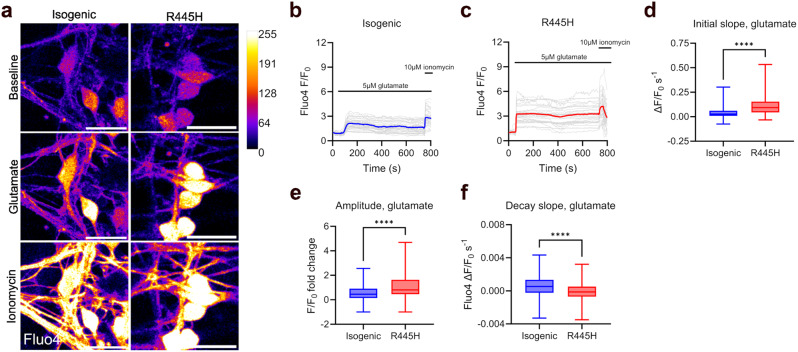
Dominant optic atrophy (DOA) is the most common inherited optic neuropathy, characterised by the selective loss of retinal ganglion cells (RGCs). Over 60% of DOA cases are caused by pathogenic variants in the OPA1 gene, which encodes a dynamin-related GTPase protein. OPA1 plays a key role in the maintenance of the mitochondrial network, mitochondrial DNA integrity and bioenergetic function. However, our current understanding of how OPA1 dysfunction contributes to vision loss in DOA patients has been limited by access to patient-derived RGCs. Here, we used induced pluripotent stem cell (iPSC)-RGCs to study how OPA1 dysfunction affects cellular homeostasis in human RGCs. iPSCs derived from a DOA+ patient with the OPA1 R445H variant and isogenic CRISPR-Cas9-corrected iPSCs were differentiated to iPSC-RGCs. Defects in mitochondrial networks and increased levels of reactive oxygen species were observed in iPSC-RGCs carrying OPA1 R445H. Ultrastructural analyses also revealed changes in mitochondrial shape and cristae structure, with decreased endoplasmic reticulum (ER): mitochondrial contact length in DOA iPSC-RGCs. Mitochondrial membrane potential was reduced and its maintenance was also impaired following inhibition of the F1Fo-ATP synthase with oligomycin, suggesting that mitochondrial membrane potential is maintained in DOA iPSC-RGCs through reversal of the ATP synthase and ATP hydrolysis. These impairments in mitochondrial structure and function were associated with defects in cytosolic calcium buffering following ER calcium release and store-operated calcium entry, and following stimulation with the excitatory neurotransmitter glutamate. In response to mitochondrial calcium overload, DOA iPSC-RGCs exhibited increased sensitivity to opening of the mitochondrial permeability transition pore. These data reveal novel aspects of DOA pathogenesis in R445H patient-derived RGCs. The findings suggest a mechanism in which primary defects in mitochondrial network dynamics disrupt core mitochondrial functions, including bioenergetics, calcium homeostasis, and opening of the permeability transition pore, which may contribute to vision loss in DOA patients.

Keywords: Calcium homeostasis; Dominant optic atrophy; Mitochondrial networks; Neurodegeneration; OPA1; Retinal ganglion cells; iPSCs.


Conflict of interest statement

Declarations. Ethics approval and consent to participate: For the use of patient-derived fibroblasts in this study, informed consent was obtained following the tenets of the Declaration of Helsinki. Ethical approval was granted by the Yorkshire and The Humber-Leeds Bradford Research Ethics Committee (REC reference: 13/YH/0310). Consent for publication: Not applicable. Competing interests: PYWM is a consultant for GenSight Biologics, Stoke Therapeutics, PYC Therapeutics and has received research support from GenSight Biologics and Chiesi. MEC is a consultant for Prime Medicine.

Figures

Fig. 1
Fig. 1
Defects in mitochondrial structure in OPA1 R445H iPSC-RGCs. (a) Representative images of the mitochondrial network in R445H and isogenic control neurons stained with Mitotracker dye, deconvoluted with Lightning software. Scale bar, 10 μm. (b-e) MINA analysis of mitochondrial networks. Isogenic, n = 37; R445H, n = 34 cells, sampled from three independent differentiations. (b) and (c), ** = p < 0.01, Mann-Whitney tests, (d) and (e), *** = p > 0.001, Welch’s t-tests. Box plots show median (middle line), 25th-75th percentile (box) and min/max values (whiskers). (f) Representative TEM images of mitochondrial structures in isogenic control and R445H iPSC-RGCs. Scale bar, 2000 nm. (g-i) Quantification of mitochondrial area, roundness, and length, performed in ImageJ. Isogenic, n = 483; R445H, n = 510 ROIs, sampled from three independent differentiations. **** = p < 0.0001, Mann-Whitney tests. Box plots show median (middle line), 25th-75th percentile (box) and min/max values (whiskers). (j & k) Quantification of mitochondrial cristae shape, performed in ImageJ. Isogenic, n = 292; R445H n = 280 ROIs sampled from three independent differentiations. **** = p < 0.0001, Mann-Whitney tests. Box plots show median (middle line), 25th-75th percentile (box) and min/max values (whiskers). (l) Quantification of mitochondria: ER contact sites, performed in ImageJ. Isogenic, n = 350; R445H n = 419 ROIs sampled from three independent differentiations. **** = p < 0.0001, Mann-Whitney tests. Box plots show median (middle line), 25th-75th percentile (box) and min/max values (whiskers). (m) Representative images of Mitotracker-stained mitochondria in TUBB3 + neurites. Scale bar, 5 μm. (n) Quantification of mitochondria length, performed in ImageJ. Isogenic, n = 1,241 ROIs; R445H, n = 625 ROIs, sampled from three independent differentiations. **** = p < 0.0001, Mann-Whitney test. Box plot shows median (middle line), 25th-75th percentile (box) and min/max values (whiskers). (o) Quantification of mitochondria distribution in TUJ1 + neurites. Isogenic/R445H, n = 14 images acquired from three independent differentiations. No significant difference observed between genotypes, p = 0.358, Mann-Whitney test. Scatter plot shows the mean values +/- SD. (p) Quantification of mitochondrial area in TUBB3 + neurites. Isogenic, n = 1,209 ROIs; R445H, n = 590 ROIs, sampled from three independent differentiations. **** = p < 0.0001, Mann-Whitney test. Box plot shows median (middle line), 25th-75th percentile (box) and min/max values (whiskers)
Fig. 2
Fig. 2
Oxidative stress and MMP defects in OPA1 R445H iPSC-RGCs. (a) DHE fluorescence signal normalised to cell number (Hoechst fluorescence). Isogenic/R445H, n = 18 wells sampled from three independent differentiations. **** = p < 0.0001, Mann-Whitney test. Scatter plot shows the mean values +/- SD. (b) MitoSOX fluorescence signal normalised to cell number (Hoechst fluorescence). Isogenic/R445H, n = 18 wells sampled from three independent differentiations. *** = p < 0.001, unpaired t-test. Scatter plot shows the mean values +/- SD. (c) Quantification of SOD1 Western blots. Isogenic/R445H, n = 12 sampled from three independent differentiations. No significant differences were observed between genotypes, p = 0.671, Mann-Whitney test. Scatter plot shows the mean values +/- SD. Western blot data is available in Supplementary Fig. 1. (d) Representative live cell confocal images of MMP in TMRE-stained isogenic control and R445H iPSC-RGCs at baseline and after FCCP treatment. Scale bar, 10 μm. (e) Quantification of MMP expressed as the fold-change in TMRE fluorescence relative to isogenic control samples. FCCP was used as a negative staining control to subtract non-mitochondrial TMRE fluorescence. Isogenic, n = 11; R445H, n = 10 images sampled from three independent differentiations. **** = p < 0.0001, unpaired t-test. Scatter plot shows the mean values +/- SD. (f) Representative live cell confocal images of TMRE-stained isogenic control and R445H iPSC-RGCs at baseline, 10 and 20 min after addition of 1.5 µM oligomycin, and following FCCP treatment. Scale bar, 10 μm. (g & h) Quantification of fold-change in TMRE fluorescence over time in isogenic control and R445H neurons. Fluorescence intensity was normalised to baseline values (F0). 1.5 µM oligomycin and 1 µM FCCP were added at the indicated time points. FCCP was used as a negative staining control to subtract non-mitochondrial TMRE fluorescence. Grey lines show individual cells TMRE fluorescence intensity from a representative experiment, blue/red lines the mean average normalised TMRE fluorescence intensity. (i) Quantification of endpoint TMRE fluorescence in isogenic control and R445H iPSC-RGCs prior to FCCP addition. Isogenic/R445H, n = 4 images acquired from three independent differentiations. ** = p < 0.01, unpaired t-test. Scatter plot shows the mean values +/- SD
Fig. 3
Fig. 3
Dysregulation of cytosolic calcium homeostasis in OPA1 R445H iPSC-RGCs in response to ER calcium release. (a) Representative live cell confocal images of cytosolic calcium levels in isogenic control and R445H neurons at D42 stained with Fluo4 at baseline, and after treatment with 1.5 µM thapsigargin and 1.2 mM CaCl2. Scale bar, 20 μm. (b & c) Quantification of fold-change in Fluo4 fluorescence intensity over time normalised to baseline values, denoted F0. 1.5 µM thapsigargin and 1.2 mM CaCl2 were added at the indicated time points. Neurons were maintained in calcium-free recording buffer until addition of CaCl2. Grey lines show Fluo4 fluorescence intensity in individual cells from a representative experiment, blue/red lines the mean average normalised Fluo4 fluorescence intensity. (d-i) Quantification of initial slope, amplitude and decay slope of Fluo4 fluorescence intensity in response to 1.5 µM thapsigargin and 1.2 mM CaCl2 in isogenic control R445H and iPSC-RGCs. Isogenic control, n = 140; R445H, n = 190 cells sampled from three independent differentiations. * = p < 0.05; **** = p < 0.0001, Mann-Whitney tests. Box plots show median (middle line), 25th-75th percentile (box) and min/max values (whiskers)
Fig. 4
Fig. 4
Cytosolic calcium homeostasis is dysregulated in response to the excitatory neurotransmitter glutamate in OPA1 R445H iPSC-RGCs. (a) Representative live cell confocal images of cytosolic calcium levels in isogenic control and R445H neurons stained with Fluo4 at baseline, and after stimulation with 5 µM glutamate and 10 µM ionomycin. Scale bar, 20 μm. (b & c) Quantification of fold-change in Fluo4 fluorescence intensity over time normalised to baseline values, denoted F0. 5 µM glutamate and 10 µM ionomycin were added at the indicated time points. Neurons were maintained in magnesium-free recording buffer throughout the experiment. Grey lines show Fluo4 fluorescence intensity in individual cells from a representative experiment, blue/red lines the mean average normalised Fluo4 fluorescence intensity. (d-f) Quantification of initial slope, amplitude and decay slope of Fluo4 fluorescence intensity in response to 5 µM glutamate in isogenic control R445H and iPSC-RGCs. Isogenic control, n = 167; R445H, n = 210 cells sampled from three independent differentiations. **** = p < 0.0001, Mann-Whitney tests. Box plots show median (middle line), 25th-75th percentile (box) and min/max values (whiskers)
Fig. 5
Fig. 5
Increased sensitivity to opening of the mPTP in OPA1 iPSC-RGCs in response to mitochondrial calcium overload. (a) Representative live cell confocal images of the MMP in Mitotracker-stained isogenic control and R445H iPSC-RGCs at baseline and after treatment with 12.5 µM and 20 µM ferutinin. Scale bar, 20 μm. (b & c) Quantification of fold-change in Mitotracker fluorescence over time in response to mitochondrial calcium overload in isogenic control and R445H neurons. Fluorescence intensity was normalised to baseline values (F0). Ferutinin concentration was increased in 2.5 µM increments at the indicated time points indicated by the arrows. Loss of Mitotracker fluorescence indicates mitochondrial depolarisation due to opening of the mPTP (grey box). (d) Quantification of ferutinin concentration required to open the mPTP. Isogenic control/R445H, n = 7 experiments (~ 350 cells/genotype) sampled from four independent differentiations. ** = p < 0.01, unpaired t-test. Scatter plot shows the mean values +/- SD

References

    1. Harvey JP, Sladen PE, Yu-Wai-Man P, Cheetham ME (2022) Induced Pluripotent Stem cells for inherited Optic neuropathies - Disease modeling and Therapeutic Development. J Neuro-Ophthalmology 42:35–44 - PubMed
    1. Yu-Wai-Man P, Griffiths PG, Gorman GS, Lourenco CM, Wright AF, Auer-Grumbach M et al (2010) Multi-system neurological disease is common in patients with OPA1 mutations. Brain 133:771–786 - PMC - PubMed
    1. Asanad S, Tian JJ, Frousiakis S, Jiang JP, Kogachi K, Felix CM et al (2019) Optical coherence tomography of the retinal ganglion cell complex in Leber’s Hereditary Optic Neuropathy and Dominant Optic Atrophy. Curr Eye Res 44:38–44 - PubMed
    1. Newman NJ, Yu-Wai-Man P, Biousse V, Carelli V (2023) Understanding the molecular basis and pathogenesis of hereditary optic neuropathies: towards improved diagnosis and management. Lancet Neurol 22:172–188 - PubMed
    1. Olichon A, Emorine LJ, Descoins E, Pelloquin L, Brichese L, Gas N et al (2002) The human dynamin-related protein OPA1 is anchored to the mitochondrial inner membrane facing the inter-membrane space. FEBS Lett 523:171–176 - PubMed

Publication types

MeSH terms

Substances

LinkOut - more resources