Review
. 2025 Jan 30;7(1):fcaf044.
doi: 10.1093/braincomms/fcaf044. eCollection 2025.

CSF production rate, resistance to reabsorption, and intracranial pressure: a systematic review and meta-analysis

Affiliations
Review

CSF production rate, resistance to reabsorption, and intracranial pressure: a systematic review and meta-analysis

Ihsane Olakorede et al. Brain Commun. .

Abstract

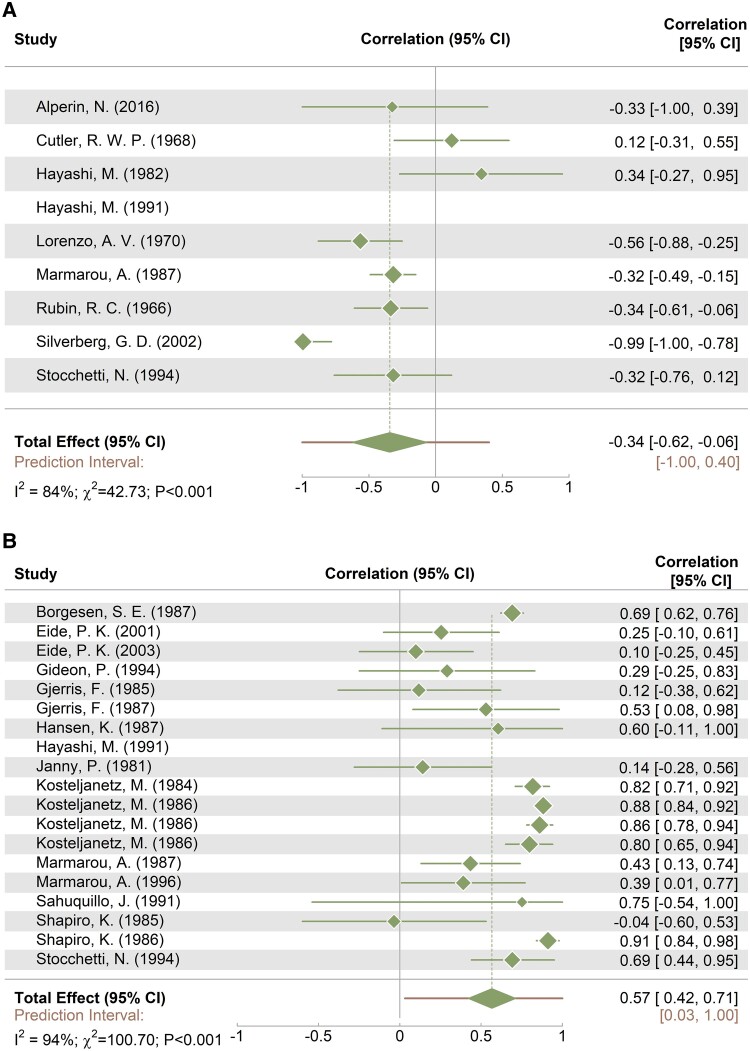
Davson's equation relates the state of stable intracranial pressure (ICP) to the production rate of CSF (IF) and resistance to CSF outflow (ROUT). Both parameters are assumed to be independent of ICP, but results are conflicting. The objective is to define the relationship between ICP, IF and ROUT using a systematic literature review. Medline and Embase were searched from inception up to 12 February 2024. Experimental studies exploring the association between ICP, IF, and ROUT were included. Individual measurements of ICP, IF and/or ROUT were extracted from tables or graphs, alongside descriptive parameters (population, ICP measurement site, disease, and computational method). Linear regression and mixed effects models were applied. From 1304 references, 25 articles were included in our meta-analysis. IF is approximately constant across all pathologies independent of the ICP level, population, disease, ICP measurement site and the measurement/estimation method. Conversely, ICP was positively correlated with ROUT. The intercorrelation, however, differed by population, disease, ICP measurement site and estimation method. Additionally, IF derived from Davson's Equation compared with the measured IF were similar for patients with hydrocephalus but differed for patients with acute brain injury. Davson's Equation describes the various components of cerebrospinal fluid dynamics. The results underline important caveats for its use in patients with acute brain injury wherein the estimated values differ from the measured ones. Overall, additional metrics describing the cerebrovascular system or the underlying disease have to be taken into account for more accurate estimations.

Keywords: cerebrospinal fluid; intracranial hypertension; intracranial pressure; meta-analysis; systematic review.


Conflict of interest statement

Nothing to report.

Figures

graphical abstract
graphical abstract
Figure 1
Figure 1
Preferred Reporting Items for Systematic Reviews and Meta-Analyses flow diagram. *Language of excluded studies: Japanese (25), German (13), Russian (12), Spanish (5), Polish (4), Italian (3), Chinese (1), Hungarian (1), Korean (1) and Turkish (1).
Figure 2
Figure 2
Forest plot of the association of intracranial pressure (ICP) with CSF production rate (IF) and resistance to outflow (ROUT). (A) IF (N = 8), and (B) ROUT (N = 18). Data name: studies; data type: continuous; effect measure: correlation; analysis model: mixed effects; statistical method: χ2 test. CI, confidence interval; I², heterogeneity measure; χ², value of χ² test for heterogeneity and P, statistical significance of the χ² test.
Figure 3
Figure 3
Relationship between ICP, IF and ROUT, over all extracted measurements, including the line of best fit and the 95% confidence interval. (A) ICP versus IF (N = 231, R² = 0.001, F = 0.2, P = 0.677). (B) ICP and ROUT (N = 676, R² = 0.405, F = 459, P < 0.001). Data name: single extracted measurements; data type: continuous; analysis model: linear regression; statistical method: ANOVA; F: F-value from the ANOVA and P: statistical significance of the ANOVA test.
Figure 4
Figure 4
Relationship between ICP, IF and ROUT for different sub-groups, including the line of best fit and the 95% confidence interval. ICP versus IF (A) per population (adult: N = 190, paediatric: N = 38; R² = 0.015; IF: F = 0.2, P = 0.681; population: F = 2, P = 0.159; interaction: F = 1, P = 0.273), (B) per disease (ABI: N = 129, brain tumour: N = 41, primary hydrocephalus: N = 9; R² = 0.025; IF: F = 0.0, P = 0.826; disease: F = 2, P = 0.130; interaction: F = 0.1, P = 0.919) and (C) ICP measurement site (cranial: N = 191, lumbar: N = 40; R² = 0.015; IF: F = 0.2, P = 0.676; measurement site: F = 2, P = 0.156; interaction: F = 1, P = 0.259). ICP versus ROUT (D) per population (adult: N = 598, paediatric: N = 78; R² = 0.423; ROUT: F = 471, P < 0.001; population: F = 20, P < 0.001; interaction: F = 1, P = 0.288), (E) per disease (ABI: N = 151, neurodegenerative: N = 66, primary hydrocephalus: N = 124; R² = 0.459; ROUT: F = 238, P < 0.001; disease: F = 23, P < 0.001; interaction: F = 0.1, P = 0.890), and (F) per ICP measurement site (cranial: N = 628, lumbar: N = 48, R² = 0.458; ROUT: F = 502, P < 0.001; measurement site: F = 65, P < 0.001; interaction: F = 2, P = 0.211), including the line of best fit and the 95% confidence interval. Data name: single extracted measurements; data type: continuous; analysis model: linear regression; statistical method: ANOVA; F: F-value from the ANOVA and P: statistical significance of the ANOVA test.
Figure 5
Figure 5
Relationship between ROUT—dependent variable and ICP—independent variable, including the line of best fit and the 95% confidence interval. (A) Per measurement method (bolus: N = 261, infusion: N = 318, withdrawal: N = 59; R² = 0.614; ICP: F = 742, P < 0.001; computation method: F = 114, P < 0.001; interaction: F = 18, P < 0.001) and (B) per disease (ABI: N = 151, neurodegenerative: N = 66, primary hydrocephalus: N = 124; R² = 0.485; ICP: F = 250, P < 0.001; disease: F = 20, P < 0.001; interaction: F = 13, P < 0.001). Data name: single extracted measurements; data type: continuous; analysis model: linear regression; statistical method: ANOVA; F: F-value from the ANOVA and P: statistical significance of the ANOVA test.

References

    1. Matsumae M, Sato O, Hirayama A, et al. . Research into the physiology of cerebrospinal fluid reaches a new horizon: Intimate exchange between cerebrospinal fluid and interstitial fluid may contribute to maintenance of homeostasis in the central nervous system. Neurol Med Chir (Tokyo). 2016;56(7):416–441. - PMC - PubMed
    1. Orešković D. The controversy on choroid plexus function in cerebrospinal fluid production in humans: How long different views could be neglected? Croat Med J. 2015;56(3):306–310. - PMC - PubMed
    1. Goriely A, Geers MG, Holzapfel GA, et al. . Mechanics of the brain: Perspectives, challenges, and opportunities. Biomech Model Mechanobiol. 2015;14(5):931–965. - PMC - PubMed
    1. Liu G, Ladrón-de-Guevara A, Izhiman Y, Nedergaard M, Du T. Measurements of cerebrospinal fluid production: A review of the limitations and advantages of current methodologies. Fluids Barriers CNS. 2022;19(1):101. - PMC - PubMed
    1. Eklund A, Smielewski P, Chambers I, et al. . Assessment of cerebrospinal fluid outflow resistance. Med Biol Eng Comput. 2007;45(8):719–735. - PubMed

LinkOut - more resources