. 2025 Feb 13;7(1):fcaf041.
doi: 10.1093/braincomms/fcaf041. eCollection 2025.

High-frequency oscillations in epileptic and non-epileptic Alzheimer's disease patients and the differential effect of levetiracetam on the oscillations

Affiliations

High-frequency oscillations in epileptic and non-epileptic Alzheimer's disease patients and the differential effect of levetiracetam on the oscillations

M C Vishnu Shandilya et al. Brain Commun. .

Abstract

Alzheimer's disease increases the risk of developing epilepsy together with cognitive decline. Early diagnosis or prediction of parameters associated with epileptic activity can greatly help in managing disease outcomes. Network hyperexcitability is a candidate of interest as a neurophysiological biomarker of Alzheimer's disease. High-frequency oscillations are increasingly recognized as potential biomarkers of hyperexcitability and epileptic activity. However, they have not yet been identified in Alzheimer's disease. In this study, we measured high-frequency oscillations via magnetoencephalography recordings in Alzheimer's disease patients with and without epileptic activity, as part of a Phase 2a randomized, double blind clinical trial of the efficacy of levetiracetam to improve cognitive functions in Alzheimer's disease. To measure the high-frequency oscillations, we used 10-min magnetoencephalography recordings (275-channel and sampling rate 1200-4000 Hz) during awake resting periods in participants with Alzheimer's disease and healthy controls. Recordings from 14 Alzheimer's disease participants, with six having non-epileptic Alzheimer's disease (median age: 60.8, 2 M/4 F), eight having sub-clinical epileptic activity (median age: 54.9, 5 M/3 F) and eight as control (median age: 71, 5 M/3 F), were analysed using two software scripts: Delphos and a custom-made script, for detecting high-frequency oscillations. Levetiracetam 125 mg twice-a-day or placebo was administered for 4 weeks in between two magnetoencephalography recordings, and 4 weeks of washout before switching levetiracetam/placebo phases for each participant. High-frequency oscillations were categorized into ripples (80 to 250 Hz) and fast ripples (250 to 500 Hz). At baseline, Alzheimer's disease participants, both epileptic and non-epileptic had higher rate of ripples and fast ripples than controls in several left/right hemispheric sensor regions (P < 0.05). Additionally, compared to epileptic, non-epileptic had higher rate of ripples in left-frontal, left-temporal and cerebral fissure regions and higher rate of fast ripples in left-frontal regions (P < 0.05). In epileptic type, levetiracetam decreased ripples in bilateral-frontal, bilateral-occipital regions and cerebral fissure, whereas in non-epileptic type, levetiracetam increased both ripples and fast ripples in right central and left parietal regions, and ripples in the right parietal region (P < 0.05). Additionally, we found hemisphere asymmetry in epileptic type, with right temporal/occipital having more high-frequency oscillations than their counterpart region. Overall, Alzheimer's disease had a high level of high-frequency oscillations, with higher numbers observed in non-epileptic type. Levetiracetam decreased high-frequency oscillations in epileptic but increased high-frequency oscillations in non-epileptic. Thus, high-frequency oscillations can function as a biomarker of hyperexcitability in Alzheimer's disease and may be more pathological when asymmetric and coinciding with presence of epileptic activity. Levetiracetam has the potential for treating hyperactivity in patients with epileptic Alzheimer's disease.

Keywords: Alzheimer’s disease; epilepsy; high-frequency oscillations; hyperactivity; levetiracetam.


Conflict of interest statement

The authors report no competing interests.

Figures

graphical abstract
graphical abstract
Figure 1
Figure 1
Switch-over treatment process. Alzheimer's disease participants had four 10-min MEG scans, with 4-week intervals between each scan. Controls had only one scan. Alzheimer's disease participants received either LEV 125 mg or placebo twice-a-day during the first 4 weeks and no treatment for the next 4 weeks. Then they received the opposite treatment (placebo or LEV) in the final 4 weeks.
Figure 2
Figure 2
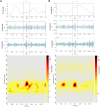
Typical MEG ripples detected by Delphos detector software. (A) Ripple 200 Hz at right temporal-44 channel and (B) ripple 212 Hz at left temporal-51. Top to bottom for each HFO: Signals with high-pass filter at 1, 80 and 250 Hz, and spectrogram of the above signal segment.
Figure 3
Figure 3
Typical MEG FR detected by Delphos detector software. (A) FR 267 Hz at right frontal-13. (B) FR 252 Hz at left temporal-31. Top to bottom for each HFO: Signals with high-pass filter at 1, 80 and 250 Hz, and spectrogram of the above signal segment.
Figure 4
Figure 4
HFOs in Alzheimer's disease. (A) Average RRs per region detected in MEG for Alzheimer's disease are shown in box plot. Alzheimer's disease had higher RR than controls in central, parietal and temporal regions, and cerebral fissure. (B) Average FRR per region detected in MEG for Alzheimer's disease are shown in box plot. Alzheimer's disease had higher FRR than controls in all regions except left occipital. P < 0.05, Student's t-test or Mann–Whitney test. The average RR or FRR of all participants within a cohort is calculated for each channel, and each regional group of channels is compared between cohorts. Number of channels (N) for each region are as follows: CL, central left (n = 24); FL, frontal left (n = 31); OL, occipital left (n = 19); PL, parietal left (n = 22); TL, temporal left (n = 33); CR, central right (n = 24); FR, frontal right (n = 33); OR, occipital right (n = 19); PR, parietal right (n = 22); TR, temporal right (n = 34); CF, cerebral fissure (n = 11).
Figure 5
Figure 5
HFOs in epileptic and non-epileptic Alzheimer's disease. (A) Average RRs per region detected in MEG for EAD and NEAD are shown in box plot. EAD had higher RR than controls in left central, left parietal, right occipital, right parietal and right temporal regions. NEAD had higher RR than controls in all regions except left occipital and right frontal. NEAD had higher RR than EAD in left frontal, left temporal and cerebral fissure. (B) Average FRR per region detected in MEG for EAD and NEAD are shown in box plot. EAD had higher FRR than controls in left central, right occipital and right temporal regions. NEAD had higher FRR than controls in all regions except left occipital and right central. NEAD had higher FRR than EAD in left-frontal region. P < 0.05, one-way ANOVA/Tukey or Kruskal–Wallis test with Dunn's multiple comparisons test. The average RR or FRR of all participants within a cohort is calculated for each channel, and each regional group of channels is compared between cohorts. Number of channels (N) for each region are as follows: CL, central left (n = 24); FL, frontal left (n = 31); OL, occipital left (n = 19); PL, parietal left (n = 22); TL, temporal left (n = 33); CR, central right (n = 24); FR, frontal right (n = 33); OR, occipital right (n = 19); PR, parietal right (n = 22); TR, temporal right (n = 34); CF, cerebral fissure (n = 11).
Figure 6
Figure 6
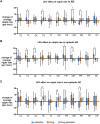
Effect of LEV on ripples. (A) Average RRs per region detected in MEG for Alzheimer's disease before and after LEV treatment are shown in box plot. LEV increased RR in Alzheimer's disease in bilateral parietal and right central but decreased RR in left-frontal and right-occipital regions. (B) Average RRs per region detected in MEG for EAD before and after LEV treatment are shown in box plot. In EAD, LEV decreased RR in bilateral-frontal and occipital regions and cerebral fissure. (C) Average RRs per region detected in MEG for NEAD before and after LEV treatment are shown in box plot. In NEAD, LEV increased RR in bilateral parietal and right central regions. P < 0.05, unpaired t-test or Mann–Whitney test. The average RR or FRR of all participants within a cohort is calculated for each channel, and each regional group of channels is compared between cohorts. Number of channels (N) for each region are as follows: CL, central left (n = 24); FL, frontal left (n = 31); OL, occipital left (n = 19); PL, parietal left (n = 22); TL, temporal left (n = 33); CR, central right (n = 24); FR, frontal right (n = 33); OR, occipital right (n = 19); PR, parietal right (n = 22); TR, temporal right (n = 34); CF, cerebral fissure (n = 11).
Figure 7
Figure 7
Effect of LEV on FR. (A) Average FRRs per region detected in MEG for Alzheimer's disease before and after LEV treatment are shown in box plot. LEV increased RR in Alzheimer's disease in bilateral parietal and right central but decreased RR in left-frontal and right-occipital regions. (B) Average FRRs per region detected in MEG for EAD before and after LEV treatment are shown in box plot. In EAD, LEV decreased RR in bilateral-frontal and occipital regions and cerebral fissure. (C) Average FRRs per region detected in MEG for NEAD before and after LEV treatment are shown in box plot. In NEAD, LEV increased RR in bilateral parietal and right central regions. P < 0.05, unpaired t-test or Mann–Whitney test. The average RR or FRR of all participants within a cohort is calculated for each channel, and each regional group of channels is compared between cohorts. Number of channels (N) for each region are as follows: CL, central left (n = 24); FL, frontal left (n = 31); OL, occipital left (n = 19); PL, parietal left (n = 22); TL, temporal left (n = 33); CR, central right (n = 24); FR, frontal right (n = 33); OR, occipital right (n = 19); PR, parietal right (n = 22); TR, temporal right (n = 34); CF, cerebral fissure (n = 11).
Figure 8
Figure 8
AI of EAD and NEAD. AI of ripples and FR in (A) EAD showed significant asymmetry in occipital and temporal regions, with higher HFOs in the right hemisphere. AI of (B) NEAD shows that there is no asymmetry in any region. N = 8 and 6 for EAD and NEAD, respectively. P < 0.05, 2-tailed 1-sample t-test versus zero. C, central; F, frontal; O, occipital; P, parietal; T, temporal; All, all regions combined.

Comment in

References

    1. Sherzai D, Losey T, Vega S, Sherzai A. Seizures and dementia in the elderly: Nationwide Inpatient Sample 1999–2008. Epilepsy Behav. 2014;36:53–56. - PubMed
    1. Vossel KA, Beagle AJ, Rabinovici GD, et al. Seizures and epileptiform activity in the early stages of Alzheimer disease. JAMA Neurol. 2013;70(9):1158–1166. - PMC - PubMed
    1. Palop JJ, Mucke L. Network abnormalities and interneuron dysfunction in Alzheimer disease. Nat Rev Neurosci. 2016;17(12):777–792. - PMC - PubMed
    1. Vossel K, Ranasinghe KG, Beagle AJ, et al. Effect of levetiracetam on cognition in patients with Alzheimer disease with and without epileptiform activity: A randomized clinical trial. JAMA Neurol. 2021;78(11):1345–1354. - PMC - PubMed
    1. Sen A, Capelli V, Husain M. Cognition and dementia in older patients with epilepsy. Brain. 2018;141(6):1592–1608. - PMC - PubMed