. 2024 Feb 20;11(2):214-221.
doi: 10.1364/optica.511359. Epub 2024 Feb 5.

Acoustic-feedback wavefront-adapted photoacoustic microscopy

Affiliations

Acoustic-feedback wavefront-adapted photoacoustic microscopy

Yuecheng Shen et al. Optica. .

Abstract

Optical microscopy is indispensable to biomedical research and clinical investigations. As all molecules absorb light, optical-resolution photoacoustic microscopy (PAM) is an important tool to image molecules at high resolution without labeling. However, due to tissue-induced optical aberration, the imaging quality degrades with increasing imaging depth. To mitigate this effect, we develop an imaging method, called acoustic-feedback wavefront-adapted PAM (AWA-PAM), to dynamically compensate for tissue-induced aberration at depths. In contrast to most existing adaptive optics assisted optical microscopy, AWA-PAM employs acoustic signals rather than optical signals to indirectly determine the optimized wavefront. To demonstrate this technique, we imaged zebrafish embryos and mouse ears in vivo. Experimental results show that compensating for tissue-induced aberration in live tissue effectively improves both signal strength and lateral resolution. With this capability, AWA-PAM reveals fine structures, such as spinal cords and microvessels, that were otherwise unidentifiable using conventional PAM. We anticipate that AWA-PAM will benefit the in vivo imaging community and become an important tool for label-free optical imaging in the quasi-ballistic regime.


Figures

Fig. 1.
Fig. 1.. Schematics of the operational principle of AWA-PAM.
a In conventional PAM, pulsed light is focused into the biological tissue to locally induce ultrasonic waves, which are measured by a focused ultrasonic transducer. The heterogeneity of the biological tissue distorts the wavefront of the focused light, decreasing the signal strength and resolution. b In AWA-PAM, a spatial light modulator modulates the wavefront of the pulsed excitation light to compensate for tissue-induced aberration. The phase map displayed by the SLM is the inverse phase of the distorted wavefront, thereby nullifying the distortion and creating a sharp focus at depths. To obtain the desired phase map, a feedback loop between the SLM, the computer, and the ultrasonic transducer is established to optimize the PA amplitude.
Fig. 2.
Fig. 2.. Compensating for inherent system aberration.
a Schematic illustration of the AWA-PAM system. The light being focused into the tissue is modulated by a spatial light modulator, which dynamically compensates for spatially inhomogeneous tissue-induced aberration. b Signal enhancement contributed by each order of Zernike modes. c An image of the focus after compensation for system aberration, captured through an optical microscope.
Fig. 3.
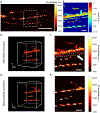
Fig. 3.. In vivo imaging of zebrafish embryos.
a Whole-body image of the zebrafish embryo, captured through conventional PAM. The white dashed square denotes the area of interest with spinal cords. Scale bar: 500 μm. b 3D image and c its 2D MAP image of the area highlighted in (a) obtained with AWA correction. Image sizes: 0.60×0.50×0.45 mm3 (x, y, z). Scale bar, 100 μm. d 3D image and e its 2D MAP image of the area highlighted in (a) obtained without AWA correction. Image sizes: 0.60×0.50×0.45 mm3 (x, y, z). Scale bar, 100 μm. f Depth information of the microstructures in the 2D MAP image in (c). Scale bar, 100 μm.
Fig. 4.
Fig. 4.. In vivo imaging of mouse ears in the natural state.
a, b Two different views of the 3D microvascular images obtained with AWA correction. Image sizes: 1.00×1.00×0.40 mm3 (x, y, z). c Corresponding 2D MAP image obtained with AWA correction. Scale bar, 200 μm. d, e Two different views of the 3D microvascular images obtained without AWA correction. Image sizes: 1.00×1.00×0.40 mm3 (x, y, z). f Corresponding 2D MAP image obtained without AWA correction. Scale bar, 200 μm. g, h Line profiles of the dashed lines in (c) and (f) for the microvascular structures obtained with (red) and without (blue) AWA correction. Scale bars, 200 μm. i Depth information of the microvascular structures in the 2D MAP image in (c). Scale bar, 200 μm.

References

    1. Sethuraman S, Amirian JH, Litovsky SH, Smalling RW, and Emelianov SY, "Spectroscopic intravascular photoacoustic imaging to differentiate atherosclerotic plaques," Opt. Express 16, 3362–3367 (2008). - PubMed
    1. He Y, Wang L, Shi J, Yao J, Li L, Zhang R, Huang C-H, Zou J, and Wang LV, "In vivo label-free photoacoustic flow cytography and on-the-spot laser killing of single circulating melanoma cells," Scientific Reports 6, 39616 (2016). - PMC - PubMed
    1. Hsu H-C, Wang L, and Wang LV, "In vivo photoacoustic microscopy of human cuticle microvasculature with single-cell resolution," Journal of Biomedical Optics 21, 056004 (2016). - PMC - PubMed
    1. Yao J and Wang LV, "Photoacoustic microscopy," Laser & Photonics Reviews 7, 758–778 (2013). - PMC - PubMed
    1. Wong TTW, Zhang R, Hai P, Zhang C, Pleitez MA, Aft RL, Novack DV, and Wang LV, "Fast label-free multilayered histology-like imaging of human breast cancer by photoacoustic microscopy," Science Advances 3, e1602168 (2017). - PMC - PubMed

LinkOut - more resources